Ethereum’s Upward Trend Stops At The 3,500 Dollar Threshold
Updated: Dec 28, 2024 at 17:53

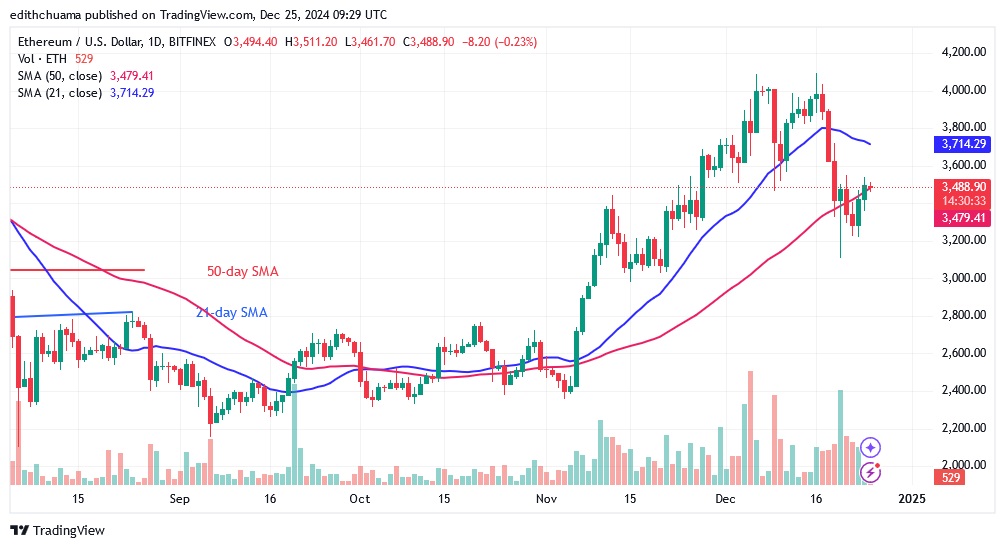
The price of Ethereum (ETH) has closed below the 50-day SMA twice, with the bulls buying the dips. The bulls are doing their best to keep the price above the 50-day moving average line.
Long-term analysis of ETH price: bearish
Now, Ether has been pushed back from the 50-day SMA. If the selling pressure intensifies, the downtrend could resume to the $3,000 support level. Buyers will protect the $3,000 support if Ether falls. The largest altcoin will be forced to trade between $3,000 and $4,094. Ether will return to the bullish trend zone if buyers keep the price above the 21-day SMA. The altcoin will rise to its previous high of $4,094. In the meantime, buyers are about to break above the 50-day simple moving average.
Analysis of the Ethereum indicators
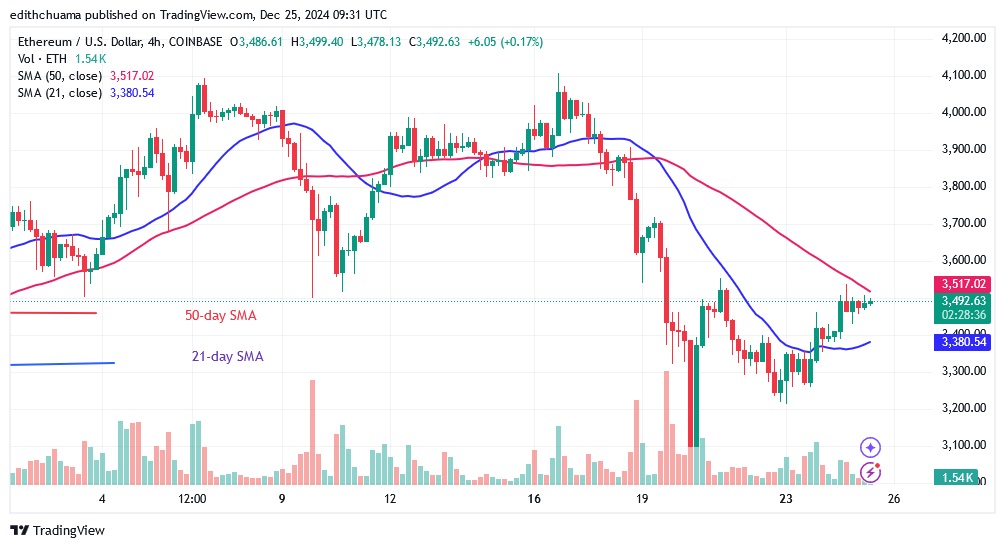
Ether price bars are below the moving average, but buyers are pushing the price above the 50-day SMA. On the 4-hour chart, the Ether price bars are between the moving average lines. This points to a likely range-bound move for the cryptocurrency. However, if buyers sustain the price above the 21-day SMA, a bullish trend will emerge.

Technical indicators:
Key resistance levels – $4,000 and $4,500
Key support levels – $3.500 and $3,000
What Is the next direction for Ethereum?
The 4-hour chart shows Ether making an upward reversal as buyers try to hold the price above the moving average lines. Ether's current price range is $3,100 to $3,600. If Ether is rejected at the 50-day SMA, it will be compelled to move within a range.

Disclaimer. This analysis and forecast are the personal opinions of the author. They are not a recommendation to buy or sell cryptocurrency and should not be viewed as an endorsement by CoinIdol.com. Readers should do their research before investing in funds.
News
News
Coin expert

(0 comments)