Ethereum Recovers But Encounters Rejection At $2,700
Updated: Aug 25, 2024 at 00:26

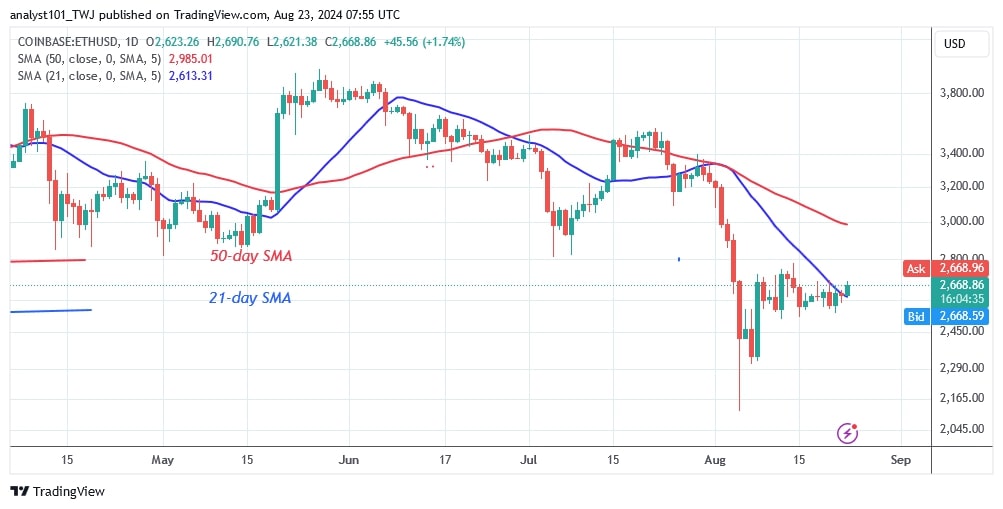
The price of Ethereum (ETH) has resumed its uptrend and has risen above the 21-day moving average. Price analysis by Coinidol.com.
Long-term price analysis: bearish
The 21-day SMA currently represents resistance for the cryptocurrency's price range. In other words, Ether is trading above the $2,200 support but below the 21-day moving average. The recent breakout will send the altcoin to its 50-day SMA high or the $3,000 mark.
However, the upside move will face initial resistance at $2,850. If ETH is rejected at its recent high, it will be trapped between the moving average lines.
On the downside, selling pressure will pick up again if the bears breach the 21-day moving average. The altcoin would then fall to its previous low above $2,200. It currently stands at $2,668.
Ethereum indicator analysis
The largest altcoin is correcting upwards after breaking above the 21-day SMA. The bullish momentum has extended to the 50-day SMA. Once the price breaks above the 21-day and 50-day moving averages, Ether will resume its uptrend. Ether is moving modestly while doji candlesticks are forming.
Technical Indicators:
Key Resistance Levels – $4,000 and $4,500
Key Support Levels – $3.500 and $3,000

What is the next direction for Ethereum?
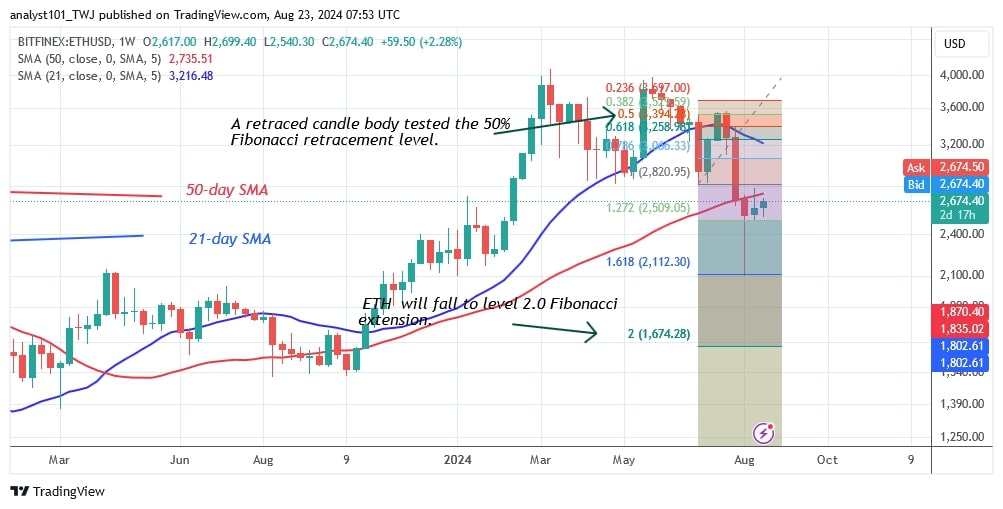
Ether is in a downtrend, but buyers have kept the price above the 21-day SMA barrier. The bullish momentum is not sustained due to the Doji candlesticks. Doji candlesticks slow down the price movement and lead to consolidation.

Disclaimer. This analysis and forecast are the personal opinions of the author. They are not a recommendation to buy or sell cryptocurrency and should not be viewed as an endorsement by CoinIdol.com. Readers should do their research before investing in funds.
Price
News
Price
Price
News

(0 comments)