Ethereum Is in a Tight Range as It Is Prone to a Price Rebound or Breakout

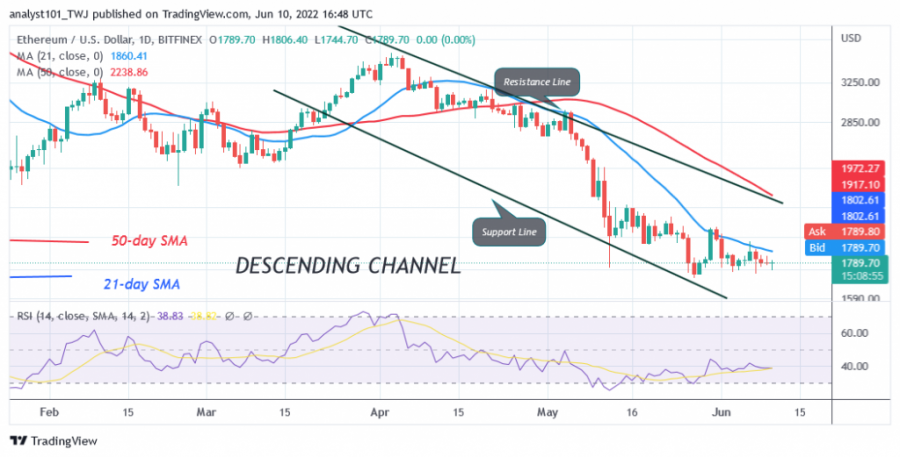
Ethereum (ETH) is in a downward correction and fluctuating in a tight range below the moving averages. On May 30, bulls tried to break out above the 21-day line SMA but were rejected. The largest altcoin has declined and is forced to trade between $1,703 and $1,875.
At the time of writing, Ether is trading at $1,778. If the bears break the support at $1,703, the altcoin will fall to the low of $1,370. On the other hand, if the current support holds, Ether will break out above the 21-day line SMA and rally above the 50-day line SMA. ETH/USD will resume its upward momentum if buyers keep the price above the moving averages. Meanwhile, Ether is moving above the $1,703 support but below the 21-day line SMA.
Ethereum indicator analysis
The cryptocurrency is at level 37 of the Relative Strength Index for period 14. Ether is in the downtrend zone as the cryptocurrency fluctuates in a narrow range. As long as the price bars are below the moving averages, Ether can go down. Ether is below the 40% range of the daily stochastic. The market is in a bullish momentum.

Technical indicators:
Major Resistance Levels - $3,500 and $4,000
Major Support Levels - $2,500 and $2,000
What is the next direction for Ethereum?
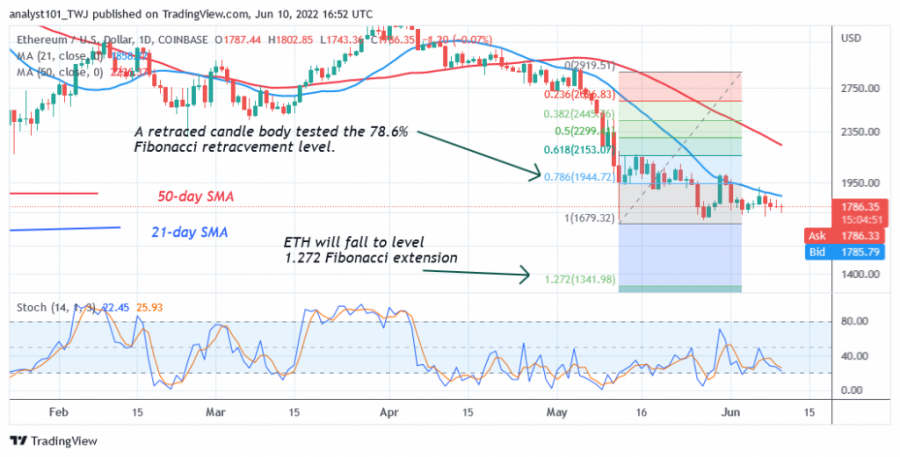
The largest altcoin is consolidating above the current support. There is a probability that the price will break down or rise again in the near future. The Fibonacci tool will hold if the current support is broken. Meanwhile, on May 12 downtrend, a retraced candle body tested the 78.6% Fibonacci retracement level. The retracement suggests that ETH will fall to the level of the Fibonacci extension of 1.272 or $1.341.

Disclaimer. This analysis and forecast are the personal opinions of the author and are not a recommendation to buy or sell cryptocurrency and should not be viewed as an endorsement by CoinIdol. Readers should do their research before investing funds.
Price
Price
Price
News

(0 comments)