Ethereum Price Analysis: ETH Selling Pressure Likely If It Fails to Overcome the Resistance

Ethereum (ETH) has been trading between the $175 and $200 demand zones since the beginning of October. The price is gradually falling as a result of more selling pressure at the demand zone.
Ethereum price Long-term Prediction: Ranging
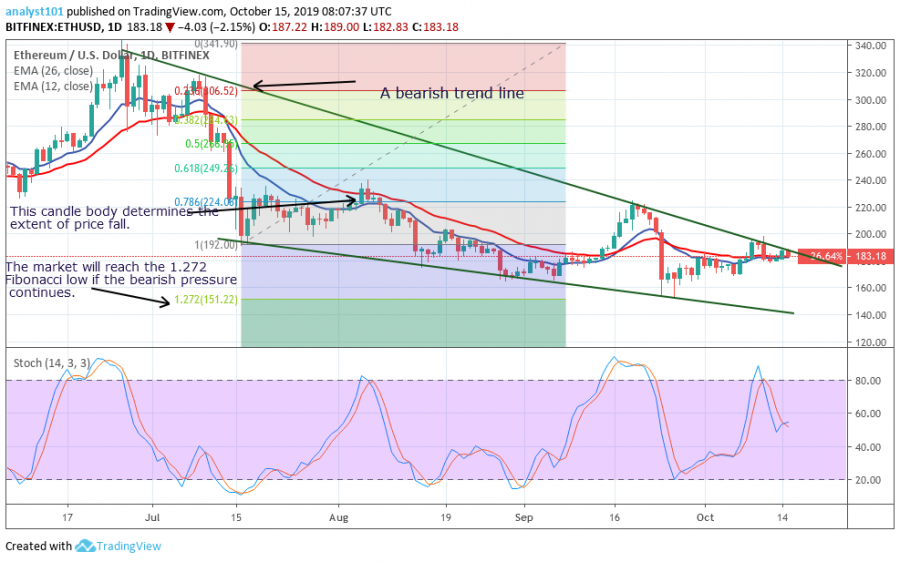
Ethereum lacks buying power as it continues to trade below the $185 demand zone in the last two weeks of October. The price made a positive move and tested the $200 demand zone but was resisted. The last time it tested the $220 supply zone, the price nosedived to the low of $160 demand zone. Following the bearish trend from inception, the market makes a gradual slide each time the price reaches the previous highs.
The Ether has fallen below the $185 price level because the market has more sellers at the $200 and $185 price levels. However, if more buyers are introduced at the higher price levels, the coin is likely to sustain its upward move. Nevertheless, if the selling pressure is overwhelming the market is likely to fall to its previous low.
Ethereum Indicator Reading
A bearish trend line is drawn showing the resistance level prices. Each time the price tests the bearish trend line, the market makes a downward move. There is a likelihood that the market will fall to its previous low at $160. However, if the price breaks above the bearish trend line and the candlestick closes above it; the coin will resume its uptrend movement.
Taking the Fibonacci tool analysis, the bullish candle body tested the 0.786 retracement level. This implies that if the bearish pressure continues the market will reach the 1.272 Fibonacci extension level. That is to say, the low of $150 demand zone. Also, the market is below the 60% range of the stochastic indicator which implies that Ethereum is in a bearish momentum.

What is the next direction for Ethereum?
Ethereum is under pressure to fall and revisit its previous low at the $160 demand zone. The price has failed to break the bearish trend line after testing it on five occasions. Presently, the market is in a bearish move, and if it continues, it may reach its previous low.
Key Supply Zones: $240, $280, $300
Key Demand zones: $200, $160, $120
Disclaimer. This analysis and forecast are the personal opinions of the author are not a recommendation to buy or sell cryptocurrency and should not be viewed as an endorsement by CoinIdol. Readers should do their own research before investing funds.
Price
Price
Price
Coin expert
News

(0 comments)