Ethereum Holds Above $1,220 And Threatens To Fall To $1,029.90

The Ethereum price (ETH) is in a downtrend and faces another rejection of the high at $1,400. The largest altcoin previously fell to a low of $1,220, but the bulls bought the dips.
Long-term analysis of the Ethereum price: bearish
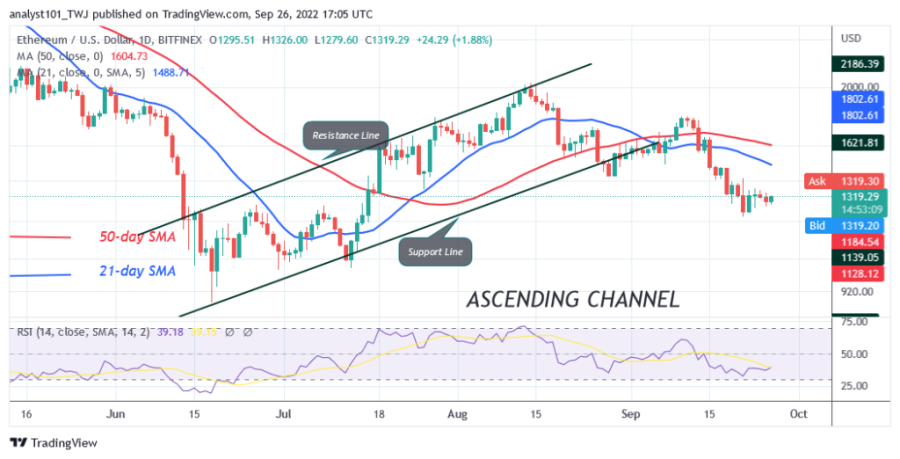
On September 21, Ether rose to the high of $1,400 but was rejected. Ether would have regained its upside momentum if buyers had overcome the current resistance. The altcoin dropped significantly above the current support and later continued a sideways movement. The downtrend will start when the price falls below the support at $1,220. The current support is the resistance level from July 8. The market will continue to fall to a low of $1,029.90 if sellers break the current support. Meanwhile, ETH /USD is moving above the $1,220 support but below the $1,400 high.
Analysis of Ethereum indicators
Ether is at level 38 of the Relative Strength Index for the period 14. It is in the downtrend zone and could fall further. The cryptocurrency will continue to fall as long as the price bars are below the moving average lines. The altcoin is above the 40% area of the daily stochastic. Ether is in a bullish momentum but has eased.

Technical Indicators
Key resistance zones: $2,500, $3,300, $4,000
Key support zones: $2,000, $1,500, $1,000
What is the next direction for Ethereum?
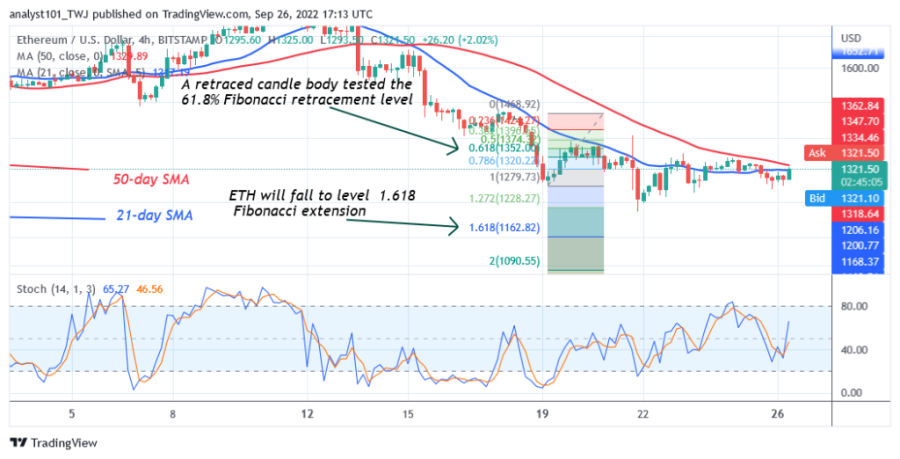
On the 4-hour chart, Ether's upside moves are slowed down by the 21-day line SMA. This means that the cryptocurrency is likely to fall further. Meanwhile, the downtrend from September 19 has found a continuation with a candlestick testing the 61.8% Fibonacci retracement level. The retracement suggests that ETH will fall to the 1.618 Fibonacci extension level or $1,162.82.

Disclaimer. This analysis and forecast are the personal opinions of the author and are not a recommendation to buy or sell cryptocurrency and should not be viewed as an endorsement by CoinIdol. Readers should do their research before investing in funds.
Price
Coin expert
News
Coin expert
Price

(0 comments)