Ethereum Holds Above $1,200 As Buyer And Seller Fail To Reach Agreement
Updated: Oct 01, 2022 at 13:41

The Ethereum price (ETH) is in a downtrend, but has resumed a sideways movement after falling to the low of $1,220.
Long-term analysis of the Ethereum price: bearish
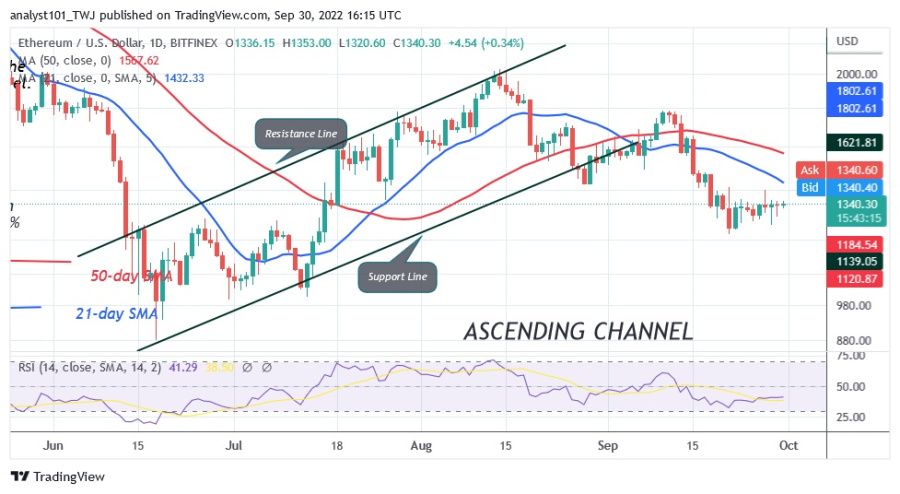
Last week, the largest altcoin did not show any trend as it settled between $1,220 and $1,400. The price action was characterized by small, indecisive candlesticks called Doji. These candlesticks indicate that buyers and sellers have reached a phase of indecision.
In the meantime, if buyers break through the resistance at $1,400, Ether will rise to the next resistance at $1,800. Selling pressure will increase again if the price falls below the support at $1,220. The market will then continue to fall to $1,162.
Analysis of Ethereum Indicator Analysis
Ether is at level 42 of the Relative Strength Index for the period 14. It is in the downtrend zone, but the altcoin has resumed its sideways movement. The price bars of the cryptocurrency are below the moving average lines, which indicates a further decline. The altcoin is below the 80% area of the daily stochastic. Ether is in a bearish momentum, but it has eased.
Technical Indicators
Key resistance zones: $2,500, $3,300, $4,000
Key support zones: $2,000, $1,500, $1,000

What is the next direction for Ethereum?
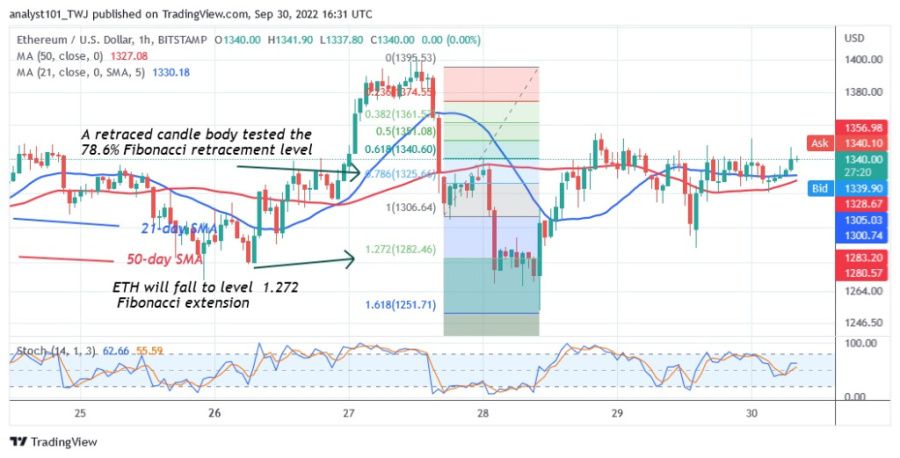
On the 1-hour chart, Ethereum is in a sideways movement after the recent decline. The cryptocurrency is currently consolidating above the $1,300 support. Meanwhile, the downtrend from September 27 has a candle body testing the 78.6% Fibonacci retracement level. The retracement suggests that ETH will fall to the 1.272 Fibonacci extension level or $1,282.46.

Disclaimer. This analysis and forecast are the personal opinions of the author and are not a recommendation to buy or sell cryptocurrency and should not be viewed as an endorsement by CoinIdol. Readers should do their research before investing in funds.
Price
News
Coin expert
Price
Price

(0 comments)