Ethereum Deepens After One Month of Sideways Movement below the Resistance Zone

The bulls and bears tussle above the support at $173. Ethereum will fall to a low at $160 if the selling pressure continues
Ethereum Price Long-Term Analysis: Bearish
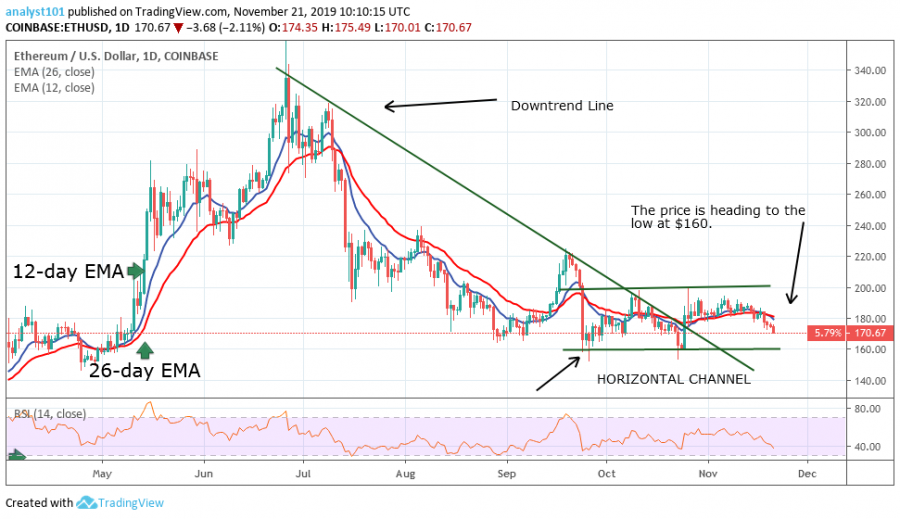
Ethereum has continued to deepen after one month of price fluctuations below the resistance level. Analysts are of the opinion in November that a breakout is imminent as the price continues to retest the resistance level.
The ETH coin’s selling pressure overwhelms the bulls as the price continues its gradual slide. Ethereum has fallen to the support above $173. The market will continue its fall to a low of $160 if the $173 support fails to hold. The support at $160 has not been broken since September. It is likely that the bulls may defend the bearish run at this level if the $173 support fails to hold.
Ethereum Indicator Analysis
The Relative Strength Index period 14 level 41 is indicating that Ethereum is trading below the centerline 50. This explains that the coin is likely to continue its fall. The EMAs are pointing southward signifying the downward move.

What Is the Next Direction for Ethereum?
Ethereum has been under bear control since a week ago. The bears broke out of the upper price range and continue a downward move. The pair may drop and find support at $160. The support is the previous level in April. This historical price level has been holding since April. The bulls are likely to defend this level.
Key Supply Zones: $220, $240, $260
Key Demand zones: $160, $140, $120
Disclaimer. This analysis and forecast are the personal opinions of the author are not a recommendation to buy or sell cryptocurrency and should not be viewed as an endorsement by CoinIdol. Readers should do their own research before investing funds.
Price
Price
Price
Price
Price

(0 comments)