Ethereum Continues Slide Around $3,300
Updated: Nov 22, 2024 at 22:20

The Ethereum (ETH) price has resumed selling pressure after reaching over the $3,200 resistance level. Price analysis by Coinidol.com.
Ethereum price long-term analysis: bullish
The largest altcoin was previously rejected at the $3,400 resistance. Buyers were unable to drive Ether to its highs of $3,600 and $3,800.
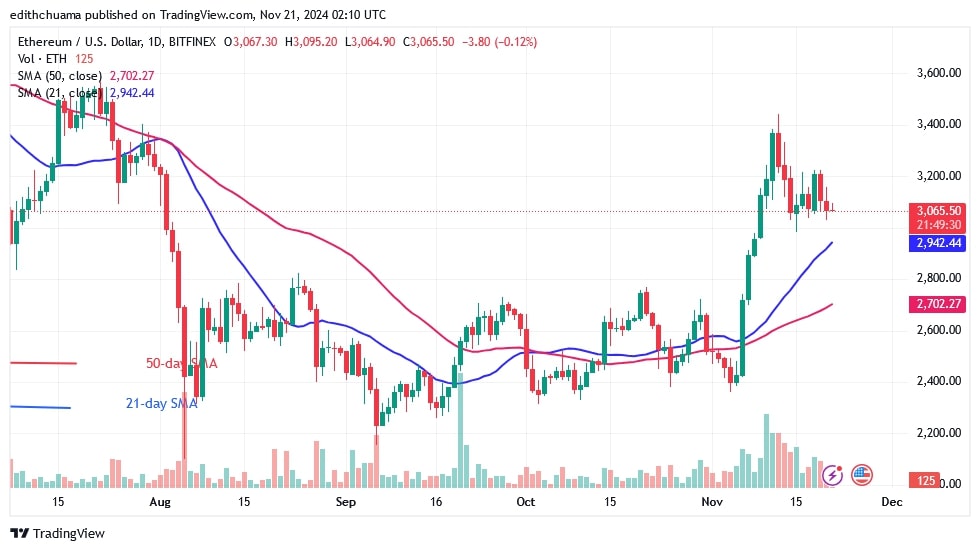
Nonetheless, the decline will continue to a floor above the 21-day SMA support or the $2,900 low. However, if the bears break the 21-day SMA support, the selling pressure will increase again. The largest altcoin will continue to fall and hit a low above the 50-day SMA or the $2,700 support. On the downside, the altcoin is likely to fall to $2,400, a key support level.
Ethereum indicator analysis
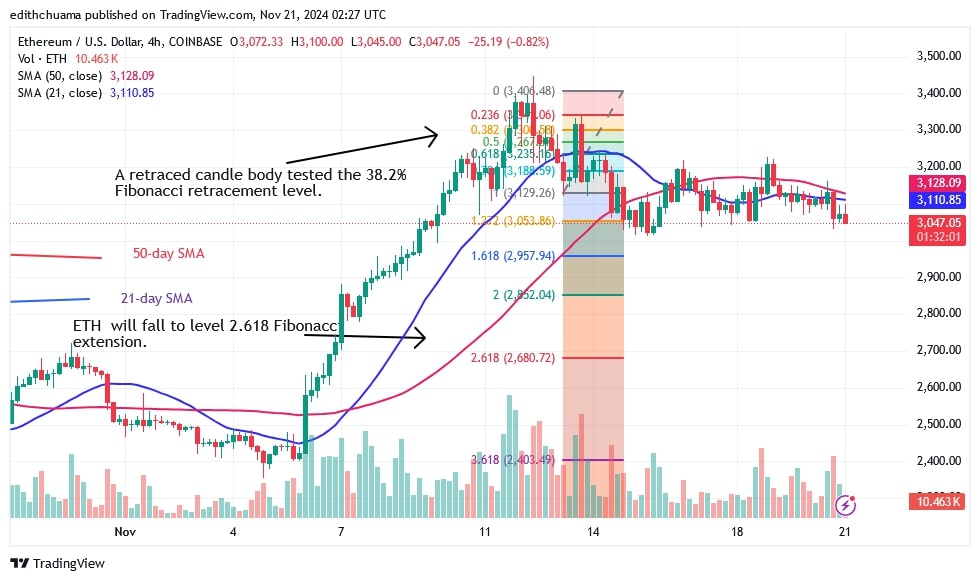
On the daily chart, the price bars remain above the moving average lines as the altcoin continues to fall. On the 4-hour chart, the price bars are below the moving average lines, indicating selling pressure. Ether's slide will continue once the $3,000 support level is broken.
Technical Indicators:
Resistance Levels – $4,000 and $4,500
Support Levels – $3.500 and $3,000

What is the next direction for Ethereum?
On the 4-hour chart, Ether price has slipped below the moving average lines but is now consolidating above the $3,000 support. According to the analysis by Coinidol.com, the moving average lines have capped Ether's upside, which means that the cryptocurrency will continue to fall.
On the downside, ETH will fall below the 2.618 Fibonacci extension or the low of $3,680.72.

Disclaimer. This analysis and forecast are the personal opinions of the author. They are not a recommendation to buy or sell cryptocurrency and should not be viewed as an endorsement by CoinIdol.com. Readers should do their research before investing in funds.
News
News
Coin expert

(0 comments)