Ethereum Current Slide Eases, Ether Holds Above $1,500

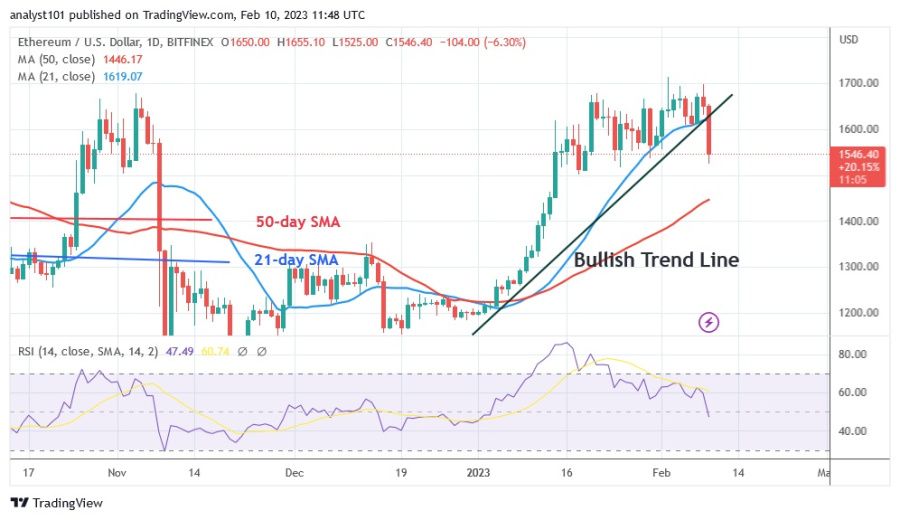
The price of Ethereum (ETH) has declined since rejecting the high of $1,714. As Ether fell to a low of $1,525, the bears broke the 21-day line SMA.
Long-term analysis of the Ethereum price: bullish
As the largest altcoin has held above the current level for the last 24 hours, the current slide has slowed down. However, the altcoin's price will fluctuate between $1,500 and $1,700 if the current support holds. Due to the recent decline, Ether is currently trading between the moving average lines. The altcoin is currently trading above the 50-day line SMA but below the 21-day line SMA. Ether fell to a low above $1,500 when the cryptocurrency's price dropped below the 21-day line SMA. If the current support is broken, the downside momentum will peak at the 50-day low SMA. In other words, Ether is trading back around $1,352, its recent low. The price of Ether is currently fluctuating between the moving average lines.
Ethereum indicator analysis
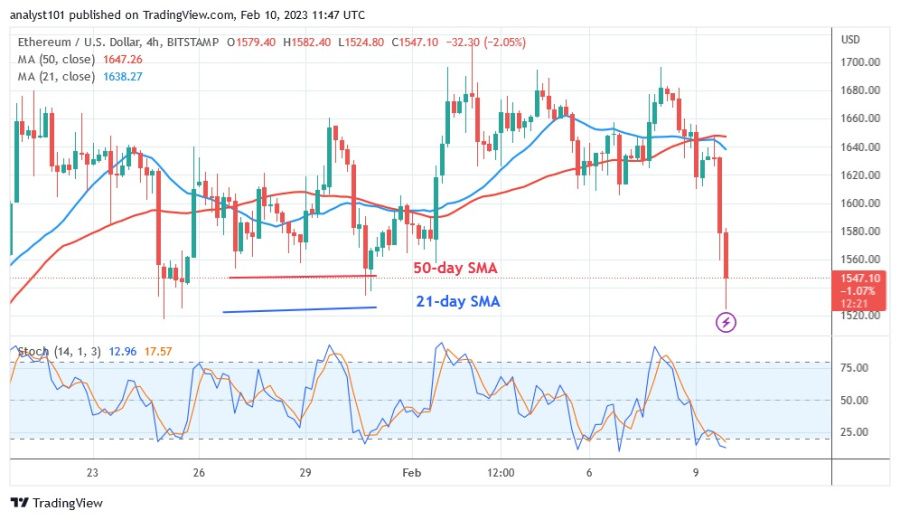
Ether has entered the bearish trend zone. On the Relative Strength Index for period 14, it is at level 47. Ether is prone to fall in value. Since the price bars for Ether are between the moving average lines, movement within the trading range is possible. On a shorter time horizon, Ether is in a downtrend below the daily stochastic level of 20. The downtrend has reached bearish fatigue.

Technical indicators:
Key resistance levels - $2,000 and $2,500
Key support levels - $1,800 and $1,300
What is the next direction for Ethereum?
The price of Ether fell to a low of $1,524 and broke the 21-day line SMA. The largest alternative coin plunged into an oversold region of the market. The altcoin crashed after two weeks of a sideways trend. Ether is trapped in the moving average lines and is forced to continue traveling in a range.

Disclaimer. This analysis and forecast are the personal opinions of the author and are not a recommendation to buy or sell cryptocurrency and should not be viewed as an endorsement by CoinIdol. Readers should do their research before investing in funds.
News
Price
Price
Price
Price

(0 comments)