Dogecoin Traded Below The Resistance Level In Anticipation Of An Uptrend

The price of Dogecoin (DOGE) has dropped to the $0.188 level.
Dogecoin price long-term forecast: bullish
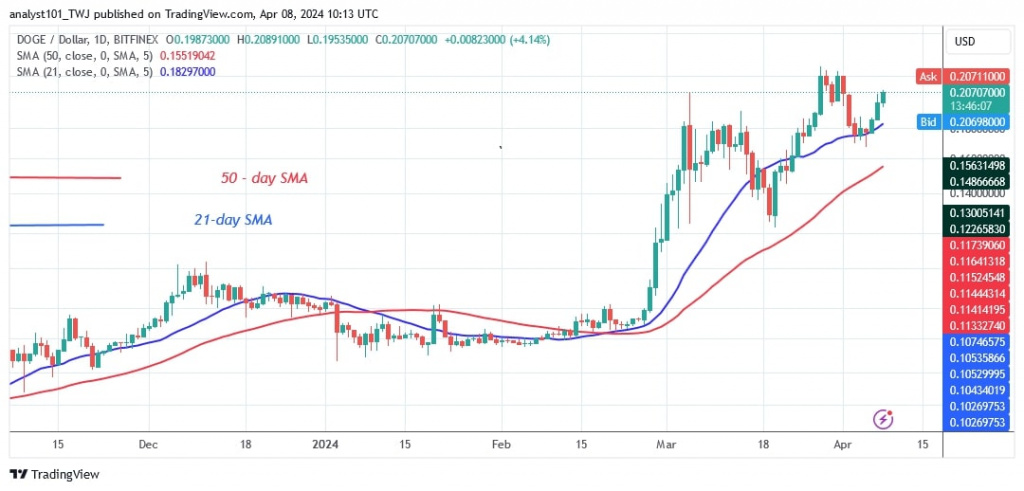
DOGE has every chance of testing the $0.23 resistance zone for the fourth time. On the upside, DOGE could reach a high of $0.30 if the $0.23 resistance is broken. The current range between the 21-day SMA and the $0.23 high will hold if DOGE is unable to break above the recent high.
In the negative price scenario, DOGE will fall below the moving average lines and move to a low of $0.12.
Dogecoin indicator reading
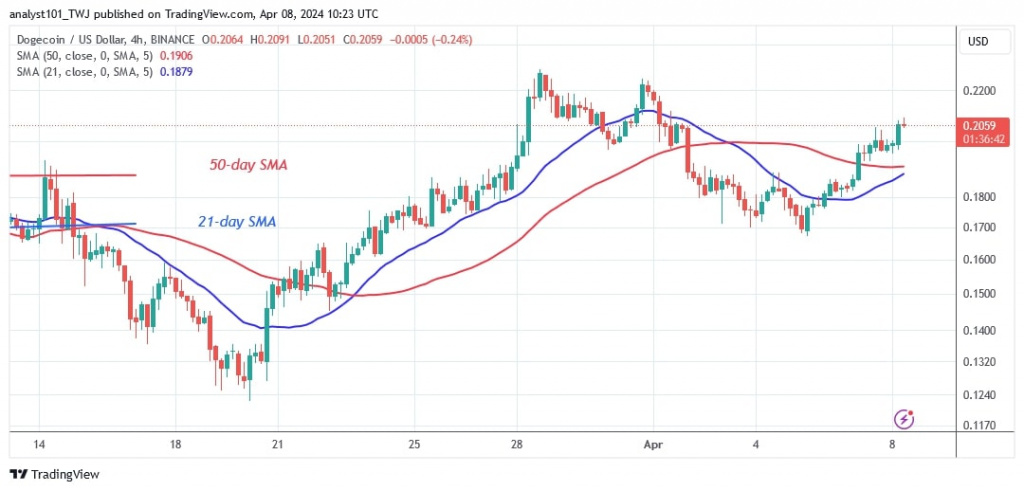
The uptrend has started as the price bars have returned above the moving average lines. The moving average lines are still pointing upwards, indicating an uptrend. On the 4-hour chart, the moving average lines are sloping horizontally, indicating a sideways trend. The current uptrend will continue if the resistance at $0.23 is broken.
Technical indicators
Key resistance levels – $0.12 and $0.14
Key support levels – $0.06 and $0.04

What is the next direction for Dogecoin?
DOGE is currently in a sideways trend and trading below the $0.23 resistance level. Buyers have made concerted efforts to break the barrier at $0.23. DOGE is currently trading above the 21-day SMA but below the resistance at $0.23 in anticipation of an uptrend. Currently the trend is up.

Disclaimer. This analysis and forecast are the personal opinions of the author and are not a recommendation to buy or sell cryptocurrency and should not be viewed as an endorsement by CoinIdol.com. Readers should do their research before investing in funds.
Price
Price
Price
News
Price

(0 comments)