Dogecoin Holds And Recovers Above $0.40
Updated: Dec 04, 2024 at 20:33

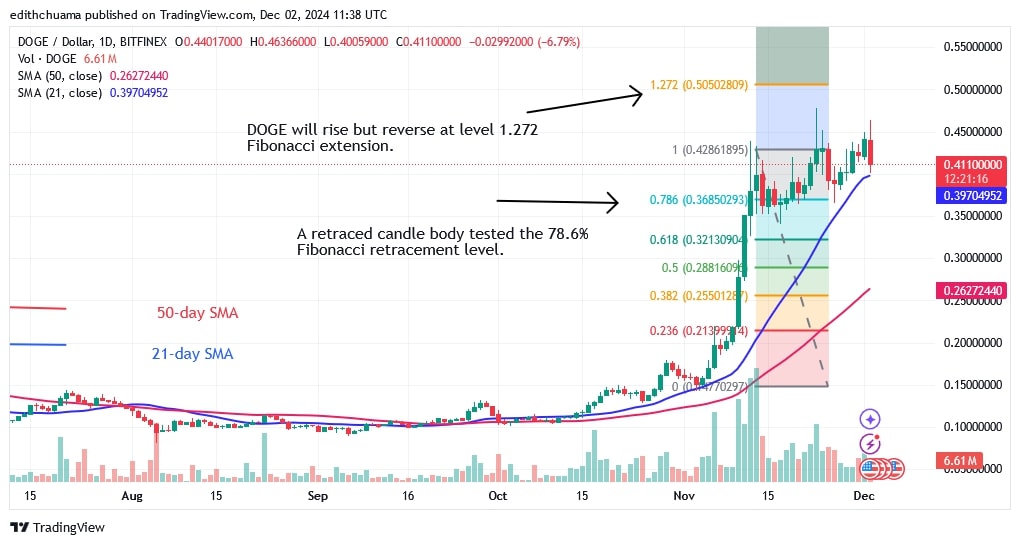
The price of Dogecoin (DOGE) has fallen below the $0.45 level. Since November 12, buyers have failed to sustain the price above the $0.45 level.
Dogecoin price long term prediction: bullish
According to Fibonacci analysis, DOGE is likely to rise to a high of $0.50 before reversing at the 1.272 Fibonacci extension or the $0.50 high. Today, DOGE was pushed back and quickly fell to a low above the 21-day SMA. The sideways movement above the 21-day SMA support and below the resistance at $0.45 will continue if the 21-day SMA support holds. The price indicator suggests that the cryptocurrency could rise in value.
However, a break below the 21-day SMA indicates a continuation of selling pressure. DOGE will fall above its 50-day SMA. DOGE is now worth $0.40.
Dogecoin indicator reading
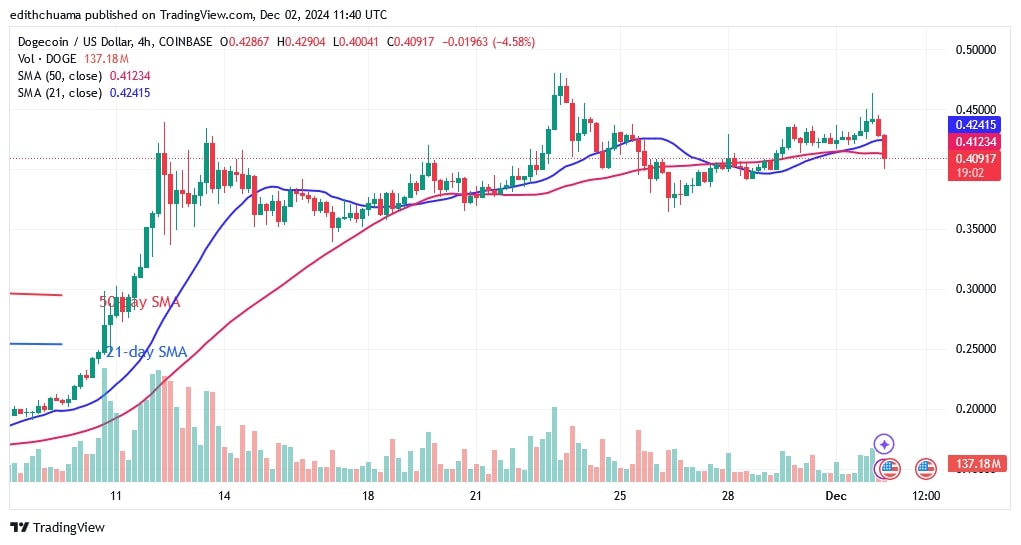
DOGE is in a downtrend towards the 21-day SMA, which serves as a support line. The 21-day SMA and the 50-day SMA are moving upwards above the moving average lines despite the recent price drop. On the 4-hour chart, the crypto price has fallen below the moving average lines, indicating a downturn.
Technical indicators
Resistance Levels $0.45 and $0.50
Support Levels – $0.30 and $0.25

What's next for Dogecoin?
On the 4-hour chart, DOGE remains in a sideways trend. The price of the cryptocurrency is trading above the $0.35 support but below the $0.45 resistance level. DOGE has fallen below the moving average lines as it continues to fall towards the lower price area. Selling pressure will stop if the $0.35 support level holds.

Disclaimer. This analysis and forecast are the personal opinions of the author, are not a recommendation to buy or sell cryptocurrency, and should not be viewed as an endorsement by CoinIdol.com. Readers should do their research before investing in funds.
News
Price
Price
News
Price

(0 comments)