Chainlink Rally Stalls at High of $52 as Altcoin Retraces for More Upside Momentum

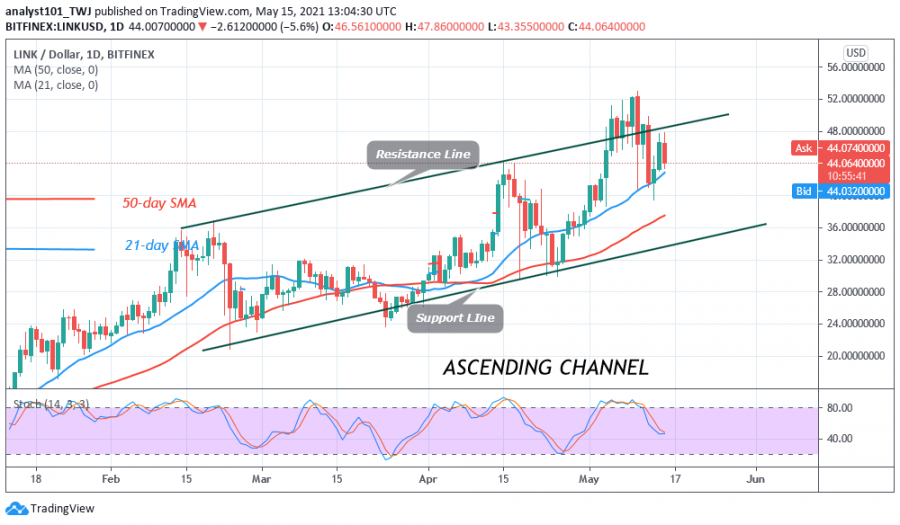
For the past week, Chainlink has been in a downward move after attaining a peak price of $52. Today, the downtrend has continued after rejection from the high of $48. The downtrend is making a series of lower highs and lower lows.
Chainlink (LINK) price Long-term Analysis: Bullish
LINK price has fallen to the low of $43 and above the 21-day SMA support. This is close to the crucial support at $42. On the downside, if the price breaks and closes below $42 support the downtrend will extend to the low of $30.
However, if the price retraces and finds support above $42 the upside momentum will resume because the LINK price is trading in the bullish trend zone. In the lower time frame, the price action is showing some candlesticks with long tails above the $40 support. These price action candlesticks are indicating that there is strong buying pressure above the $40 support. Nonetheless, the current retracement is likely to terminate in the bullish trend zone.
Chainlink (LINK) Indicator Reading
Despite the retracement, the LINK price is above 21-day and 50-day SMAs. This indicates that the market is likely to rise. LINK price is below 80% range of the daily stochastic. It indicates that the altcoin has bearish momentum. However, the stochastic bands are sloping upward indicating a bullish signal.

Technical indicators:
Major Resistance Levels – $55 and $60
Major Support Levels – $30 and $25
What Is the Next Move for Chainlink (LINK)?
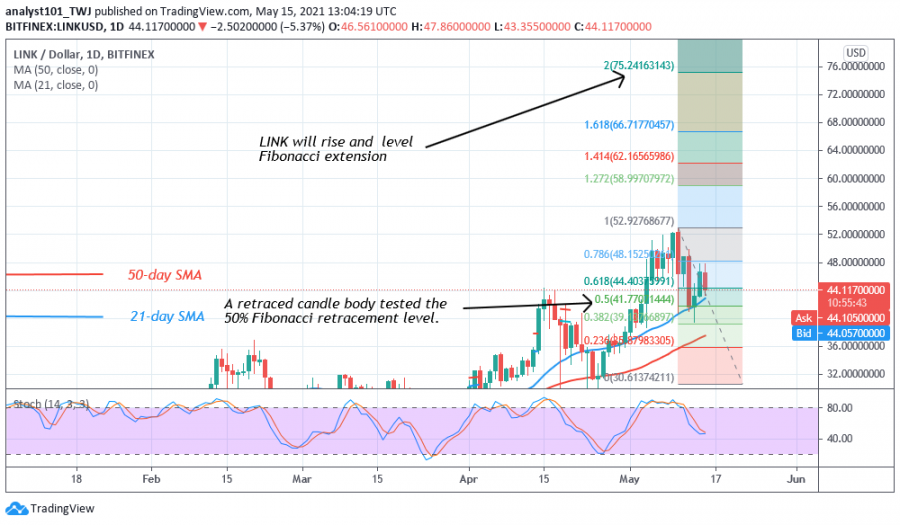
Chainlink is in an uptrend but it is retracing to the support of the 21-day SMA. On May 9 uptrend; a retraced candle body tested the 50% Fibonacci retracement level. This retracement implies that the market will rise to level 2.0 Fibonacci extensions or the high of $75.24.

Disclaimer. This analysis and forecast are the author’s personal opinions, are not a recommendation to buy or sell cryptocurrency and should not be viewed as an endorsement by Coin Idol. Readers should do their own research before investing funds.
Price
Price
Price
Coin expert
News

(0 comments)