Chainlink Retests $34 Resistance Zone, May Slide to $30 Low

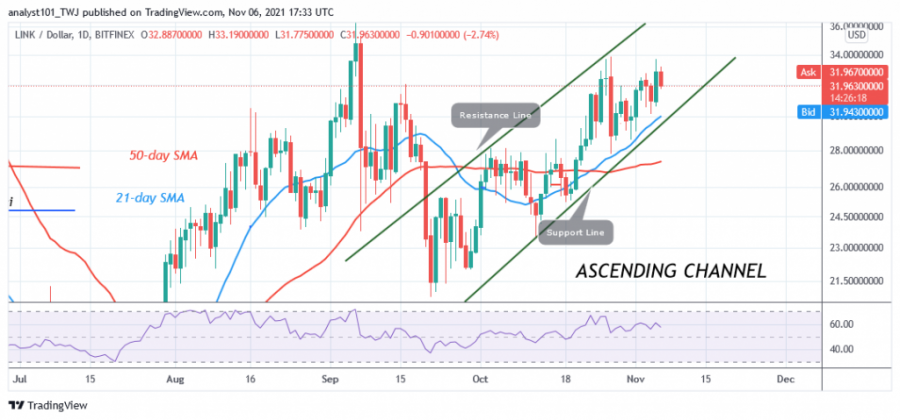
Chainlink (LINK) is declining after retesting the $34 resistance zone. The current retracement is likely to extend to the low of $30.
In other words, the market will retrace above the 21-day moving average line. Chainlink is falling as the market reaches an overbought area. In addition, resistance at $34 has not been breached since May 25. If support at $30 fails to hold, LINK/USD will fall further to $26. Nevertheless, the market will resume a new uptrend if the price retraces and finds support above $30.
Chainlink indicator reading
Chainlink is at level 57 of the Relative Strength Index of period 14. The cryptocurrency is in the uptrend zone and above the midline 50. The upward movement is likely to continue. The LINK price has a bullish crossover. That is, the 21-day line SMA crosses above the 50-day line SMA, which is a buy signal. The altcoin is below the 40% area of the daily stochastic. The market is in a bearish momentum.

Technical indicators:
Major Resistance Levels - $55 and $60
Major Support Levels - $20 and $15
What is the next move for Chainlink?
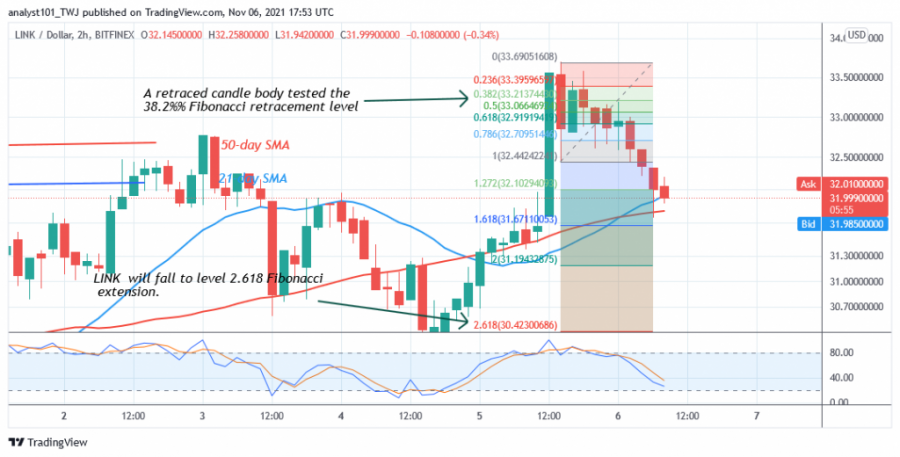
Chainlink is in a downtrend. The cryptocurrency price has fallen above the 50-day line. Meanwhile, the downtrend from November 5 has shown a candlestick testing the 38.2% Fibonacci retracement level. The retracement suggests that LINK will fall to the 2.618 Fibonacci extension level or the $30.42 high.

Disclaimer. This analysis and forecast are the personal opinions of the author and are not a recommendation to buy or sell cryptocurrency and should not be viewed as an endorsement by Coin Idol. Readers should do their own research before investing funds.
Coin expert
Price
Price
Coin expert
Price

(0 comments)