Cardano Price Consolidates And Approaches The Rebound Above $0.42

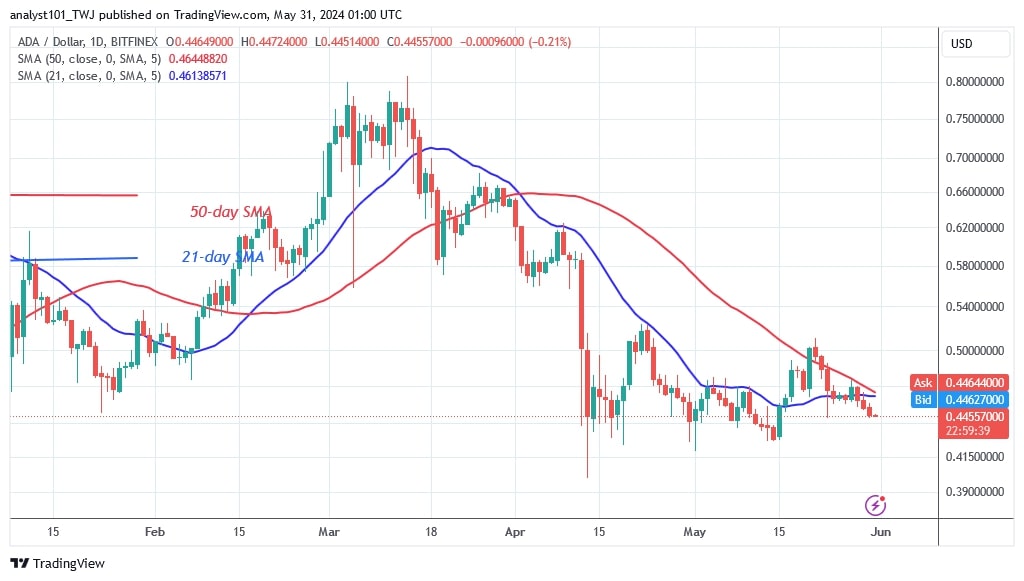
The price of Cardano (ADA) has fallen below the moving average lines after being rejected twice at the $0.51 resistance.
Long-term forecast for the Cardano price: ranging
The price of the cryptocurrency has been fluctuating between $0.42 and $0.51. On April 22, the bulls tried to resume the uptrend but were stopped by the resistance at $0.51 and the 21-day simple moving average line.
On May 20, the ADA price was rejected at the $0.51 resistance and the 50-day simple moving average. Cardano has fallen to a low of $0.44, approaching the current support of $0.42. If the existing support is broken, ADA's price will fall to $0.40. Nonetheless, the range-bound movement will continue if the current support at $0.42 is maintained.
Analysis of the Cardano indicators
The price bars for ADA have fallen below the moving average lines as the altcoin's decline continues. The cryptocurrency was previously trapped between the moving average lines for a week. The altcoin is trading near the moving average and current support lines. The altcoin is likely to rally or break down as it faces a close.
Technical indicators
Key resistance zones: $0.80, $0.85 and $0.90
Key support zones: $0.50, $0.45 and $0.40

What is the next move for Cardano?
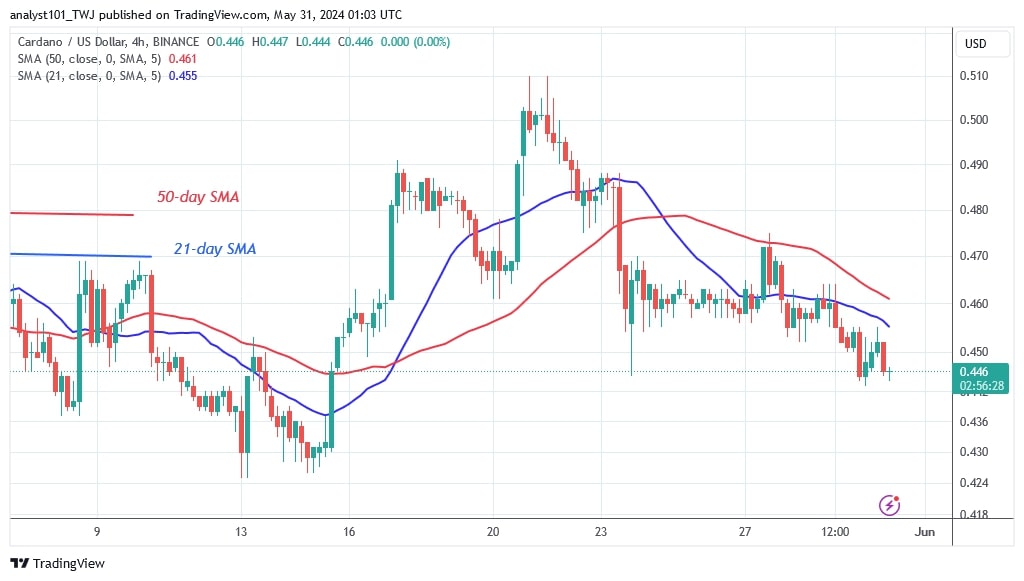
The 4-hour chart of Cardano shows a drop below the moving averages. The negative momentum has slowed above the $0.44 support. The bears have retested the existing support level and resumed consolidation above it. The crypto signal is constrained by the altcoin's range-bound movement.

Disclaimer. This analysis and forecast are the personal opinions of the author and are not a recommendation to buy or sell cryptocurrency and should not be viewed as an endorsement by CoinIdol.com. Readers should do their research before investing in funds.
News
Price
News
Price
Price

(0 comments)