Cardano Enjoys Strong Support But Risks A Drop To $0.25

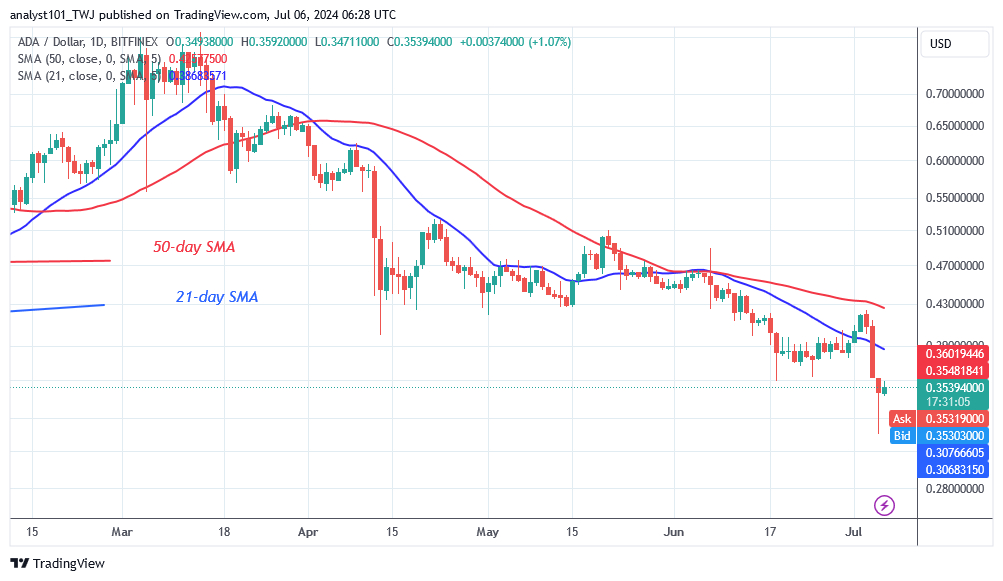
The price of Cardano (ADA) has fallen below the moving average lines after being trapped by them on July 1. Cryptocurrency price analysis brought by Coinidol.com.
Cardano price long term forecast: bearish
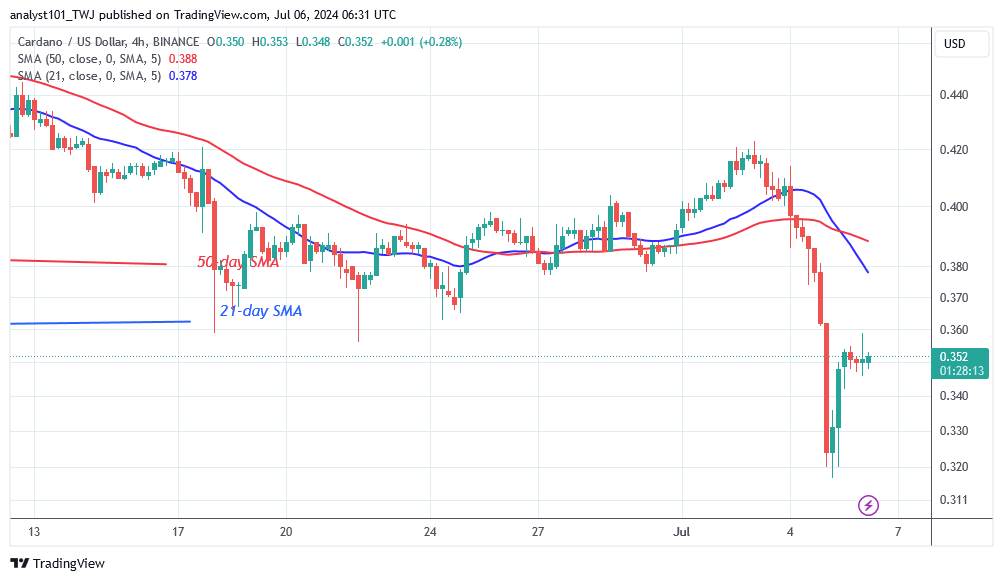
In the previous market activity, altcoin moved above the $0.35 support but below the moving averages. After the rise on July 1, the price of the cryptocurrency was caught between the moving average lines. However, the uptrend was short-lived as it encountered resistance at the 50-day moving average line. On the downside, bearish momentum broke through the 21-day SMA and the current support at $0.35, leading to a low of $0.31. The bulls bought the dips and the altcoin started its upward correction. The price of Cardano is expected to fall further and reach lows of $29 and $25. Cardano is now trading at $0.35.
Cardano indicator analysis
Cardano's trading range has been broken with the moving average lines trending downwards. The extended candlestick tail after the pullback points to the current low of $31. The extended candlestick tail signals strong buying at the $31 support level.

Technical indicators
Key resistance zones: $0.80, $0.85 and $0.90
Key support zones: $0.50, $0.45, and $0.40
What is the next move for Cardano?
Cardano has fallen below the moving average lines and touched the oversold level of the market. On the 4-hour chart, the altcoin has dropped to the low of $0.31 and has started a move above the current support, which is range-bound. The upward move has reached resistance at $0.35. The selling pressure will continue as the altcoin turns lower from its recent high.

Disclaimer. This analysis and forecast are the personal opinions of the author, are not a recommendation to buy or sell cryptocurrency, and should not be viewed as an endorsement by CoinIdol.com. Readers should do their research before investing in funds.
Price
Price
News
Price
Price

(0 comments)