Bitcoin Consolidates Above $60,000 As Traders Show Apathy
Updated: Oct 08, 2024 at 20:19

The price of Bitcoin (BTC) has been above the psychological $60,000 mark since October 1. BTC price analysis by Coinidol.com.
Bitcoin price long-term forecast: bullish
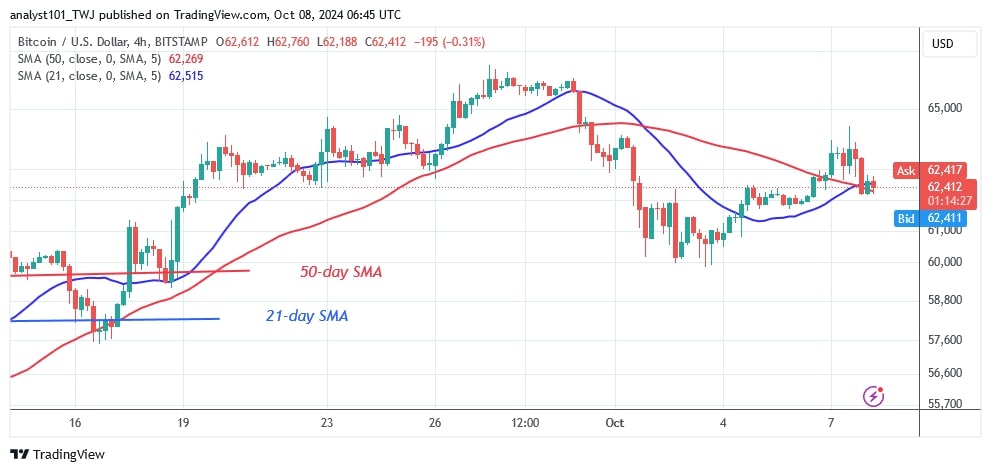
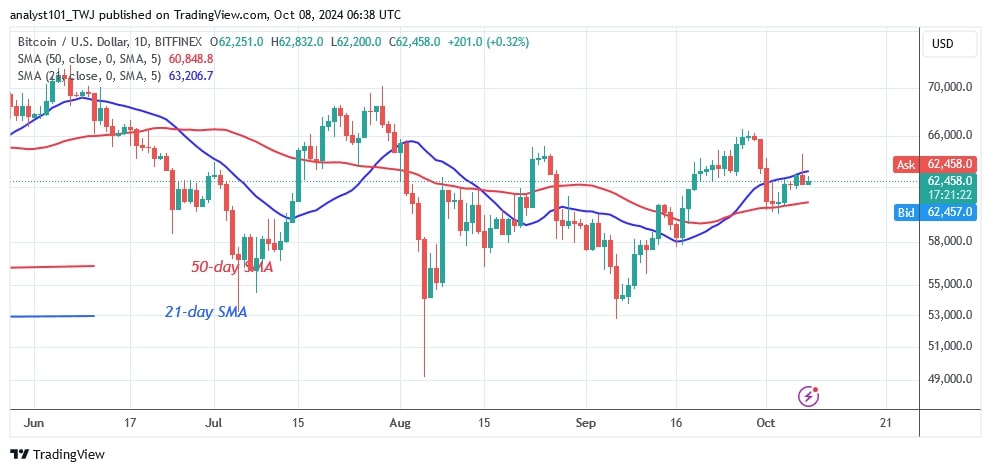
Buyers have stopped the selling pressure after recovering above the $60,000 support or the 50-day SMA. The largest cryptocurrency is between the 21-day and 50-day moving averages. The BTC price will not move until the moving average lines are broken.
On October 7, buyers tried to hold the price above the 21-day SMA but were rejected. The cryptocurrency has returned between the moving average lines. The crypto price is fluctuating between the moving average lines as doji candlesticks form. Bitcoin will fall further if it loses the 50-day SMA support or a low at $60,000.
On the downside, Bitcoin will retest the previous low at $57,650. Today, Bitcoin is worth $62,358 at the time of writing.
BTC indicator reading
Bitcoin remains trapped between the moving average lines and faces a rejection from the 21-day SMA. There are doji candlestick formations that will continue to confine Bitcoin within the moving average lines. The small body candlestick formation reflects traders' hesitation about the market direction.

What is the next direction for BTC/USD?
Bitcoin has fallen sharply and is now trading below the $64,000 barrier. The price change has been limited to the $60,000 to $64,000 price range. Bitcoin price is consolidating as a doji light is forming. If the cryptocurrency continues to move in a limited range, its price will bounce or break out.

Disclaimer. This analysis and forecast are the personal opinions of the author. They are not a recommendation to buy or sell cryptocurrency and should not be viewed as an endorsement by CoinIdol.com. Readers should do their research before investing in funds.
Price
Price
News
News
Price

(0 comments)