Bitcoin Falls And Continues Its Consolidation Between $37,000 And $40,330

Bitcoin (BTC) price is in a downward correction as buyers were rejected from the resistance zone at $39,000.
Bitcoin (BTC) price long-term forecast: bearish
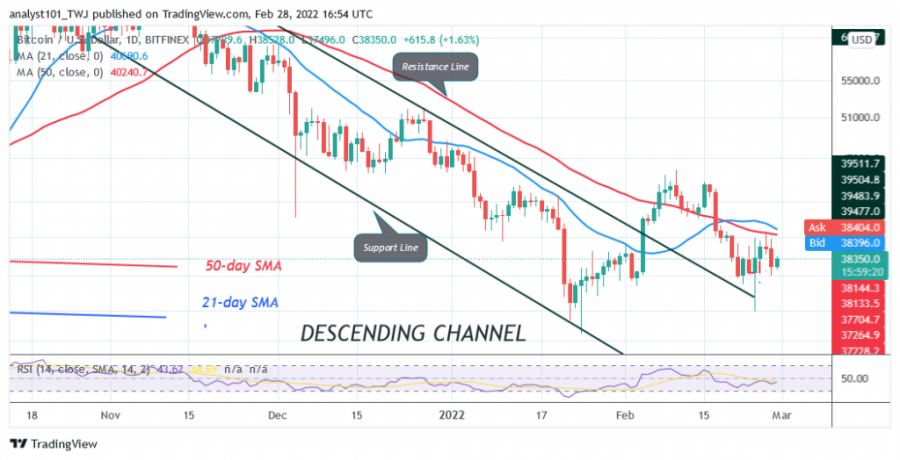
Today, February 28, 2022, the largest cryptocurrency has fallen to a low of $37,806 as of press time. The current downtrend is due to the failure of buyers to break above the moving averages. A break above the moving averages will accelerate Bitcoin's upward movement. Moreover, Bitcoin might have reached the overriding resistance at $45,000 again.
Nonetheless, Bitcoin will continue to decline after the recent decline and revisit the previous low of the February 21 price drop. In the Feb. 21 slump, Bitcoin fell to the low of $36,829 and continued to consolidate above the current support. If the selling pressure continues, the bears will revisit the previous low at $36,829. The cryptocurrency will continue to fall to the low of $33,855. However, if the support at $36,829 holds, BTC/USD will resume trading in a range between $36,800 and $39,000.
Bitcoin (BTC) indicator reading
BTC price is at level 42 of the Relative Strength Index for the period 14. Bitcoin is in the downtrend zone and below the centre line 50. Bitcoin is trading in the downtrend zone as the BTC price is below the moving averages. BTC/USD is below the 20% area of the daily stochastic. Bulls bought the dips as buyers appeared in the oversold region. The current support seems to be holding, giving the impression that the price could move within a certain range.

Technical Indicators:
Key resistance levels - $65,000 and $70,000.
Important support levels - $60,000 and $55,000
What is the next direction for BTC/USD?
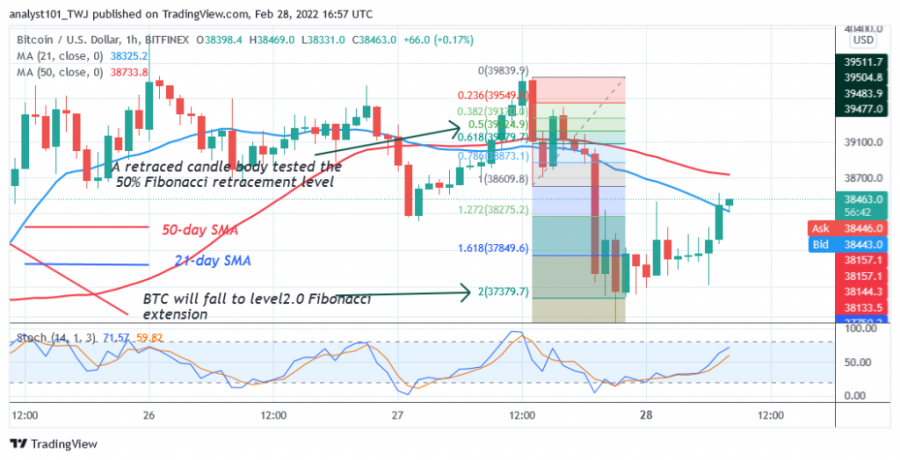
The price of Bitcoin (BTC) has been moving downwards over the last 48 hours. The downtrend seems to have eased after reaching the low of $37,051. On February 27, the bears broke the lower price range as the price fell to the low of $37,051. Meanwhile, on February 27, the downtrend; a retracement candlestick tested the 50% Fibonacci retracement level. The retracement suggests that Bitcoin will fall to the 2.0 level of the Fibonacci extension or the low of $37,366.40.

Disclaimer. This analysis and forecast are the personal opinions of the author are not a recommendation to buy or sell cryptocurrency and should not be viewed as an endorsement by CoinIdol. Readers should do their own research before investing funds.
Price
Coin expert
News
Price
Price

(0 comments)