BNB Fluctuates Below $630 As Traders Are Undecided
Updated: Apr 08, 2024 at 18:08

The price of Binance Coin (BNB) has entered a sideways trend after rejecting the high at $645.
BNB price long term forecast: bullish
The upward movement was further hindered by resistance at $630.
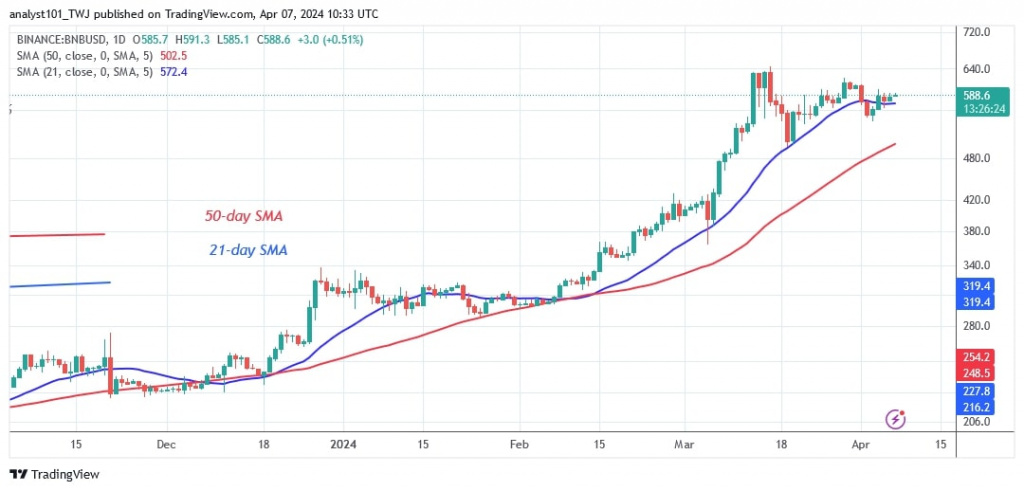
On March 29, BNB fell below the 21-day SMA and reversed the uptrend at the high of $621. The bulls bought the dip and the altcoin recovered above the 21-day SMA. The cryptocurrency is trading above the moving average lines but remains range-bound between $550 and $630.
On the upside, a recovery to $645 is possible if the altcoin recovers above the 21-day SMA. Beyond that, a break above the $645 resistance level would propel the altcoin to highs above $700. Should the bullish scenario fail, the altcoin will decline and settle in a range between $550 and $630.
BNB indicator reading
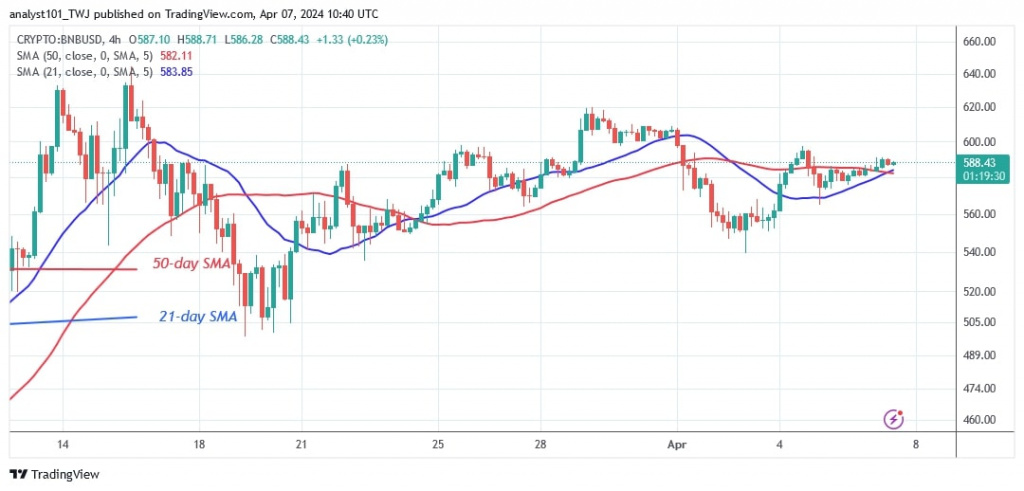
The price bars are above the moving average lines, but the upside has been limited by the Doji candlesticks. On the 4-hour chart, doji candlesticks have dominated the price action. This shows that traders are undecided about the direction of the market.
Technical indicators:
Key resistance levels – $600, $650, $700
Key support levels – $400, $350, $300

What is the next direction for BNB/USD?
BNB is trading sideways on the 4-hour chart. The altcoin is currently trading between $540 and $620. The price movement is immobile due to the dominance of small candlestick bodies known as doji candles. Once the price of the altcoin recovers, it will start trending upwards again.

Disclaimer. This analysis and forecast are the personal opinions of the author and are not a recommendation to buy or sell cryptocurrency and should not be viewed as an endorsement by CoinIdol.com. Readers should do their research before investing in funds.
Price
Price
News
News
Price

(0 comments)