Binance Coin Reaches Bearish Exhaustion but Holds Above $250

Binance Coin (BNB) price is in a downtrend as it has fallen to a low of $207 but has recovered above the $240 support. The cryptocurrency has reached bearish exhaustion as the altcoin has fallen to the low of $207.
Binance Coin (BNB) Price Long Term Forecast: Bearish
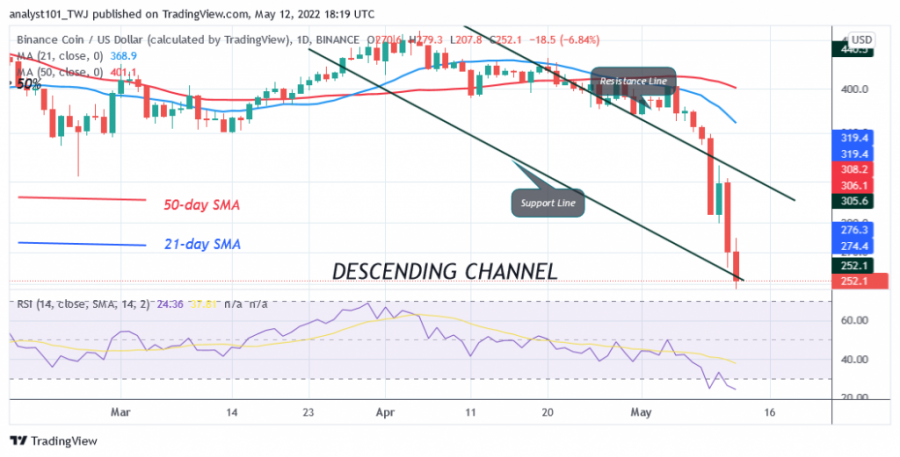
On April 29, the bears broke through the historical price of $320. The $320 support has held since February 24. The bears broke through the $320 price level and retested it before crashing to a low of $207.
Today BNB/USD is trading at $249 after the recent pullback. The bearish candlestick is showing a long candlestick today. The long candlestick tail indicates that there is strong buying pressure at the current support. Selling pressure has eased as the BNB price holds above the $250 price level.
Binance Coin (BNB) Indicator Display
The altcoin is at level 24 of the Relative Strength Index for period 14, indicating that the market has reached the oversold region. Buyers are emerging in the oversold region while prices are moving up. Binance Coin is below the 40% area of the daily stochastic. This indicates that the market was previously in a bearish momentum.

Technical Indicators:
Key resistance levels - $700 and $750.
Key support levels - $400 and $350
What is the next direction for BNB/USD?
BNB/USD has reached bearish exhaustion as it moves above the $250 price level.
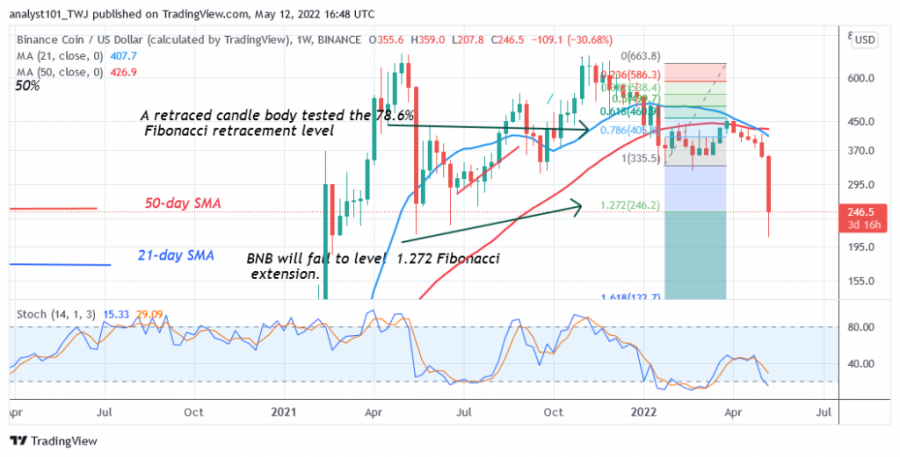
On the weekly chart, a candlestick has tested the 78.6% Fibonacci retracement level. The retracement suggests that BNB will fall to the 1.272 Fibonacci extension level or $251.40. The price action shows that the altcoin fell below the level of the 1.272 Fibonacci extension, but recovered.

Disclaimer. This analysis and forecast are the personal opinions of the author and are not a recommendation to buy or sell cryptocurrency and should not be viewed as an endorsement by CoinIdol. Readers should do their own research before investing funds.
Coin expert
Price
Price
Coin expert
Price

(0 comments)