Bitcoin Pushes to $11,600 High, Targets $12,000 Overhead Resistance
In the last 48 hours, BTC rebounded to break the $11,500 resistance and to reach the $11,609 high. The price has retraced to the support above $11,400 for a possible upward move.
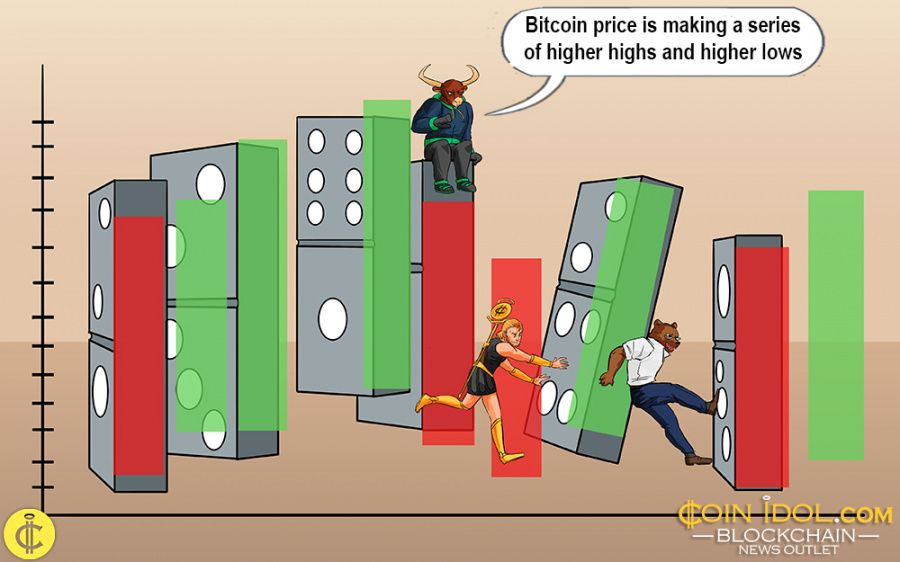
Incidentally, this has been the price pattern since October 8 in the lower time frame. In other words, the BTC price is making a series of higher highs and higher lows. We have seen the price action of a “higher low” above $11,300. What we are expecting is the price action of a “higher high”. The next price action is likely to be at the $11,800 or the $12,000 overhead resistance.
However, if the bulls hit the $12,000 overhead resistance, BTC will be compelled again to retrace for a further upward move. Nevertheless, if the bullish momentum returns, the $12,000 is likely to be broken. A retest at the $12,460 resistance will follow. Eventually, if the $12,460 is breached, a rally above the $13, 000 high is expected. Conversely, the current bullish momentum will be invalidated if the bulls fail to sustain the momentum above the SMAs.
Bitcoin indicator reading
BTC price is well above the SMAs indicating that the coin will make a possible rise on the upside. The moving averages have made a bullish crossover as the 21-day SMA crosses over the 50-day SMA. This indicates a bullish signal. The SMAs are now sloping upward indicating the uptrend.

Key Resistance Zones: $10,000, $11,000, $12,000
Key Support Zones: $7, 000, $6, 000, $5,000
What is the next direction for BTC/USD?
In the current analysis, the Fibonacci tool has indicated a possible retest of the $12,000 overhead resistance. However, the coin will be compelled to retrace, and then resume upward. On the October 12 uptrend, the coin reached a high of $11,609 but was resisted. The retraced candle body tested the 78.6% Fibonacci retracement level. This indicates that BTC is heading to 1.272 Fibonacci extension level which is $12,070.90 high.

Disclaimer. This analysis and forecast are the personal opinions of the author that are not a recommendation to buy or sell cryptocurrency and should not be viewed as an endorsement by CoinIdol. Readers should do their own research before investing funds.
Price
Coin expert
Price
News
Coin expert

(0 comments)