Bitcoin Continues To Rise And Targets A High Of $64,500

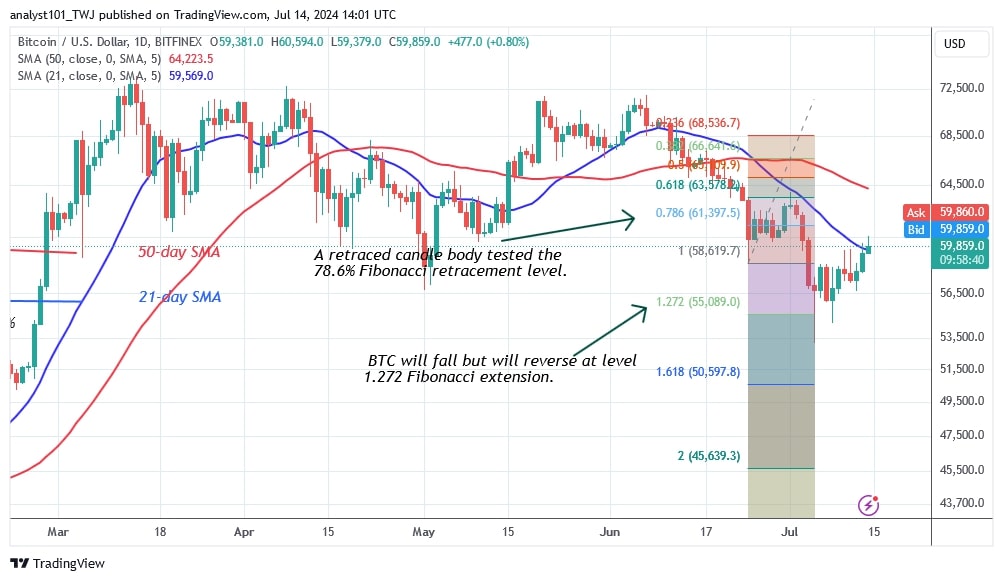
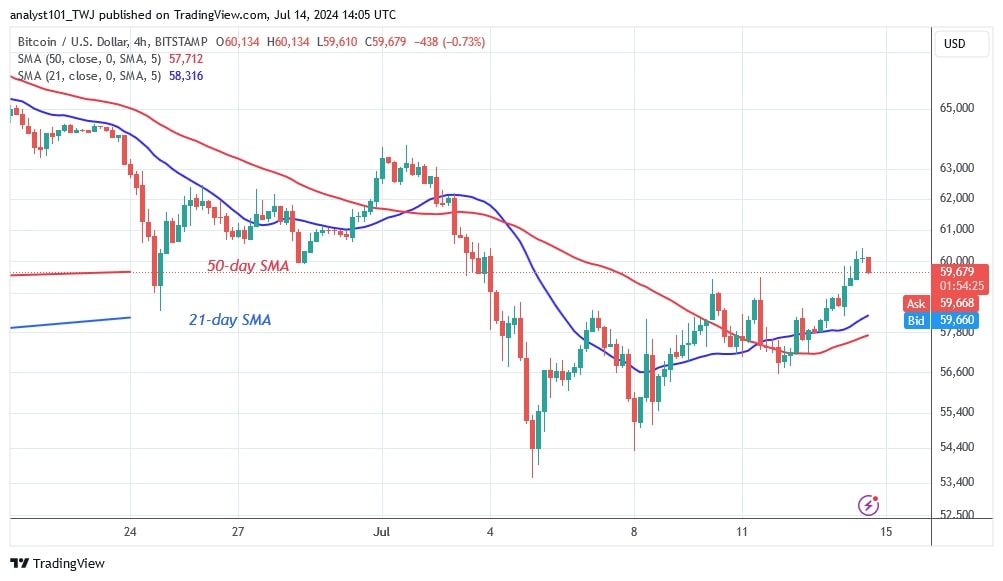
The Bitcoin (BTC) price has made a bullish push, rising above the 21-day SMA and reaching a high of $61,600.
Long-term forecast for the Bitcoin price: bearish
Today, bulls are struggling to sustain their bullish momentum above the 21-day SMA. Should the 21-day SMA support hold, the largest cryptocurrency will rise above the 50-day SMA and reach a high of $64,500.
However, Bitcoin will maintain its range-bound move above the $55,000 support and below the 21-day SMA resistance if it fails to break above the 21-day SMA.
On the downside, Bitcoin could fall if the current support of $55,000 is broken. The market will reach the psychological price of $50,000 again. Bitcoin is currently worth $61,600.
Bitcoin indicator reading
The price of the cryptocurrency has broken above the 21-day SMA resistance, but the bulls are struggling to maintain positive momentum above it. The price of the cryptocurrency is falling between the moving average lines. Which means that Bitcoin is trading above the 21-day SMA but below the 50-day SMA. The cryptocurrency is likely to be stuck between the moving average lines unless it manages to break through them.
Technical indicators:
Key resistance levels – $70,000 and $80,000
Key support levels – $50,000 and $40,000

What is the next direction for BTC/USD?
Bitcoin has continued its uptrend by breaking through the 21-day SMA resistance line. Currently, the uptrend is hitting a first resistance at $61,500. Once the first resistance is broken, the market could rise to the top of the 50-day SMA. In the meantime, Bitcoin has maintained a positive trend above the 21-day SMA.

Disclaimer. This analysis and forecast are the personal opinions of the author and are not a recommendation to buy or sell cryptocurrency and should not be viewed as an endorsement by CoinIdol.com. Readers should do their research before investing.
Coin expert
News
Coin expert
News
Price

(0 comments)