Bitcoin Takes A Break And Goes For Aggressive Buying At $64,000

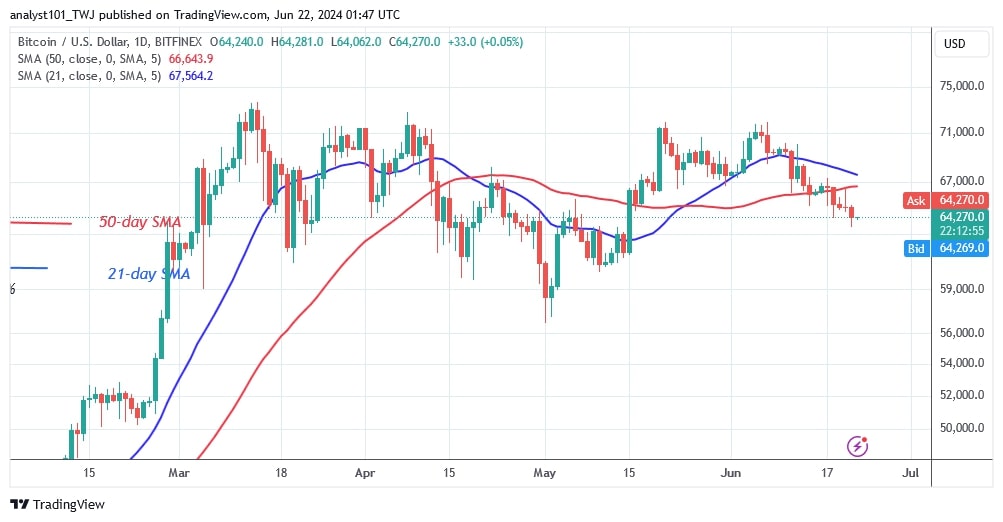
The price of Bitcoin (BTC) has fallen further below the moving average lines while remaining above the $64,300 support.
Long-term forecast for the Bitcoin price: bearish
The largest cryptocurrency is likely to fall as long as it remains in the downtrend zone. On the upside, Bitcoin will resume its uptrend if the bulls defend the current support level of $64,300. The cryptocurrency will rise and retest its moving average lines. A break above the moving average lines will propel Bitcoin to the high of $70,000.
However, if the bullish scenario is invalidated, Bitcoin will be forced into a sideways trend. The cryptocurrency will trade above the support level of $64,000 but below the moving average lines. In contrast, the bears will break the $64,000 support and force Bitcoin to crash. The largest cryptocurrency risks a drop to a low of $60,000 if the current support is broken. Bitcoin is currently valued at $64,226.
Bitcoin indicator reading
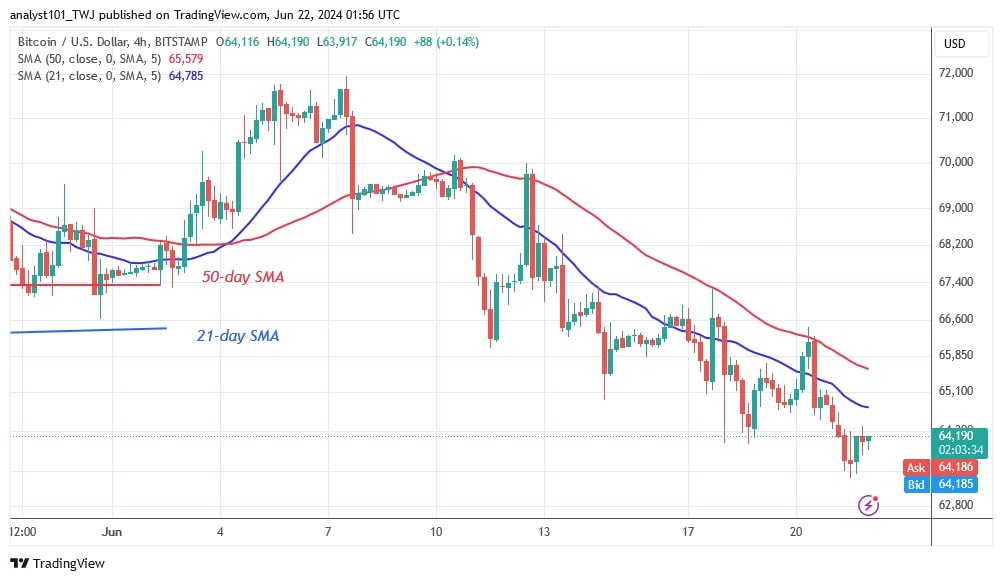
The cryptocurrency value has started to fall as the price bars continue to be below the moving average lines. On the 4-hour chart, the moving average lines are sloping south while the price bars are forming a series of lower highs and lower lows. Bitcoin is trading modestly while doji candlesticks appear.
Technical indicators:
Key resistance levels – $70,000 and $80,000
Key support levels – $50,000 and $40,000

What is the next direction for BTC/USD?
The largest cryptocurrency fell to a low of $63,356, but the bulls bought the dips on June 21. Bitcoin has been trading just above the $64,000 support level in recent days. It is hovering above the current price of $64,000, making the direction of the market unpredictable. Meanwhile, Bitcoin is trading above $64,000 but below the 21-day SMA or barrier at $65,000.
Previously, on June 15, Coinidol.com reported that BTC/USD was worth $65,716 and could fall to $60,000 if it loses the 50-day SMA support.

Disclaimer. This analysis and forecast are the personal opinions of the author and are not a recommendation to buy or sell cryptocurrency and should not be viewed as an endorsement by CoinIdol.com. Readers should do their research before investing in funds.
Price
Blockchain
Price
Price
Price

(0 comments)