Bitcoin Struggles above $28,000 Support May Revisit the Previous Low

The price of Bitcoin (BTC) is in a sideways movement as the bears try to break below the crucial support. On May 23, the bears pushed the bitcoin price to the low of $28,863, while the bulls bought the dips.
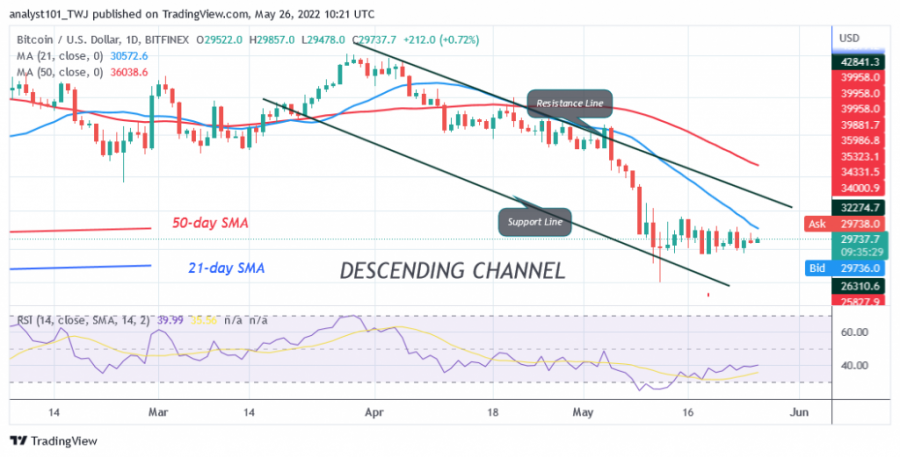
Then, buyers pushed the largest cryptocurrency to a high of $30,219 on May 25. Today, the BTC price is trading at $29,680 as of press time. On May 25, bitcoin was bumped off the 21-day moving average line. The moving average is sloping downward, which acts as resistance for the price bars.
The bottom line is that further upward price movement is limited by the 21-day moving average line. Bears are putting pressure on the crucial support, which will lead to further downward movement. If Bitcoin rallies today, it will break above the moving averages but recover to the psychological price level of $40,000. Conversely, if the bears break below the $28,000 support, Bitcoin will fall and recover the previous low of May 12. That is the low of $25,401.
Bitcoin indicator reading
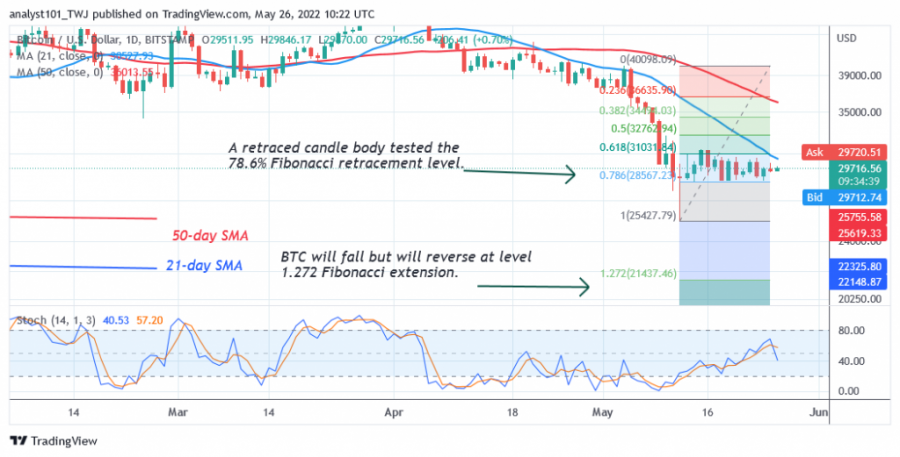
Bitcoin is at level 39 of the Relative Strength Index for period 14. The largest cryptocurrency asset is in the downtrend zone as it is gradually falling. The moving averages are sloping south, indicating a downtrend. The 21-day moving average (blue line) acts as a resistance line. Bitcoin is below the 40% area of the daily stochastic. The market is in a bearish but unstable momentum.

Technical indicators:
Major Resistance Levels - $65,000 and $70,000
Major Support Levels - $60,000 and $55,000
What is the next direction for BTC?
Bitcoin is still consolidating above $28,000 support as sellers continue to try to test current support. Fibonacci tool analysis will confirm if the bears fall below $28,000 support. Meanwhile, on May 12 downtrend, a retraced candle body tested the 78.6% Fibonacci retracement level. The retracement suggests that Bitcoin will continue to fall to the 1,272 Fibonacci extension or $21,437.

Disclaimer. This analysis and forecast are the personal opinions of the author and are not a recommendation to buy or sell cryptocurrency and should not be viewed as an endorsement by CoinIdol. Readers should do their research before investing funds.
Coin expert
Price
Price
Price
News

(0 comments)