Bitcoin SV Not Looking Strong After Month of Downtrend

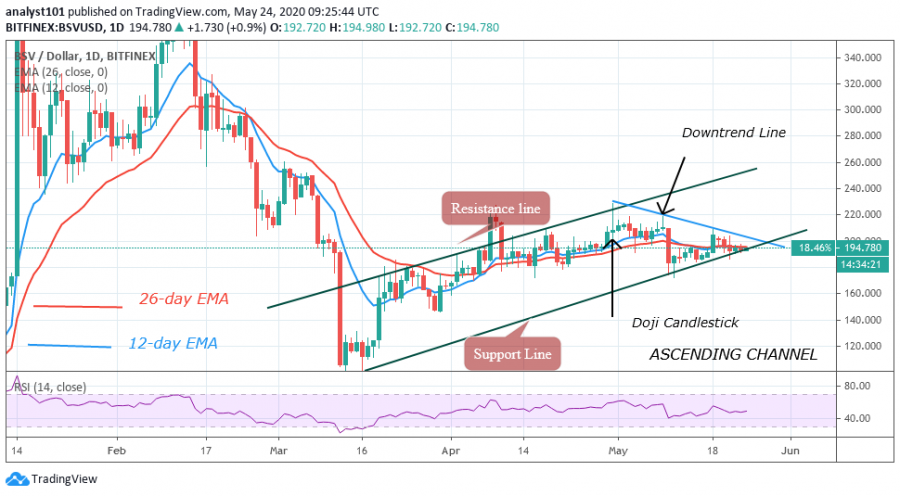
After the last breakdown in March, buyers have found the $227 resistance impenetrable to date. The two attempts to break the resistance in April were repelled by the bears.
In the last attempt, a Doji candlestick appeared with a long upper shadow indicating that buyers were attempting to push prices higher but were rejected by selling pressure.
The downtrend has continued to $175 low after another breakdown on May 10. The bulls made upward correction but were rejected at the $205 resistance. BSV is now consolidating above $193, characterized by small body indecisive candlesticks. The upward move is possible if the price breaks above the downtrend line and closes above it.
Bitcoin SV indicator reading
Buyers have failed to push prices above the downtrend line since April 30. A break above the downtrend line will signal the resumption of the uptrend. BSV is at level 48 of the Relative Strength Index period 14. This indicates that the crypto is in the downtrend zone and may likely fall.

Key Resistance Zones: $320, $340, $360
Key Support Zones: $140, $120, $100
What is the next direction for BSV/USD?
Bitcoin SV has been battling to break the overhead resistance at $227. The bearish reaction has made the crypto to fall to a low of $193. Nonetheless, the market is still in consolidation, a rebound above $193 low is likely to propel price above the downtrend line. Possibly a retest at the $227 resistance is likely.
Disclaimer. This analysis and forecast are the personal opinions of the author that are not a recommendation to buy or sell cryptocurrency and should not be viewed as an endorsement by CoinIdol. Readers should do their own research before investing funds.
Price
Price
Price
Price
Price

(0 comments)