Bitcoin Stops Below $70,000 Due To Further Rejections
Updated: Apr 07, 2024 at 12:43

The price of Bitcoin (BTC) has entered a sideways trend after failing to break above resistance at $73,666. Price analysis by Coinidol.com.
Bitcoin price long-term forecast: bullish
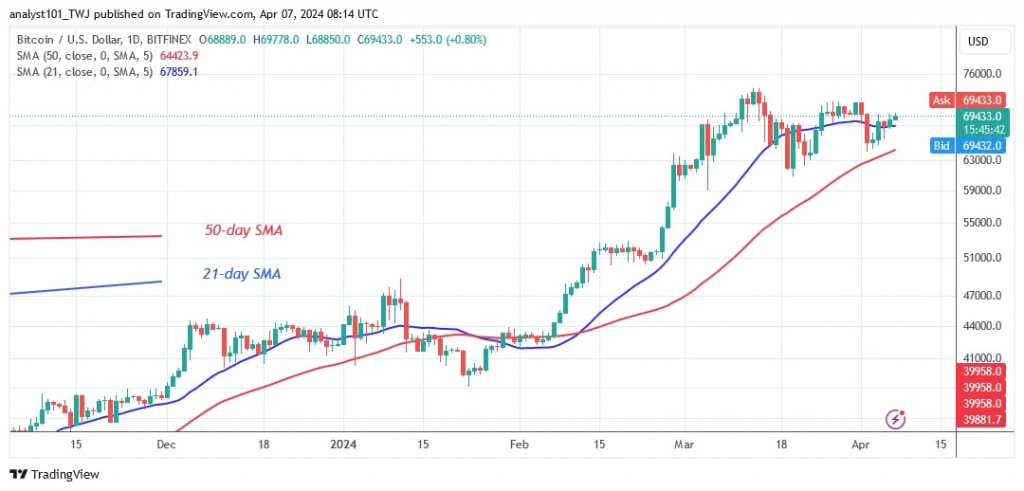
The bears successfully broke through the 21-day SMA support twice, sending Bitcoin lower, but the bulls bought the dips. The largest cryptocurrency recovered above the 21-day SMA twice and started a sideways movement. The price barrier of $70,000 and $72,000 further restricts the uptrend.
On the downside, Bitcoin could fall if the bears break below the 50-day SMA or the $63,000 support. The cryptocurrency would then fall to a low of $51,000. Meanwhile, Bitcoin is trading at prices between $63,000 and $72,000. The value of the cryptocurrency currently stands at $69,524 (as at the editorial deadline).
Bitcoin indicator reading
The BTC price has risen twice above the 21-day SMA, which was previously trapped between the moving average lines. The emergence of doji candles represents traders who are uncertain about the direction of the market.
Technical Indicators:
Key resistance levels – $70,000 and $80,000
Key support levels – $50,000 and $40,000

What is the next direction for BTC/USD?
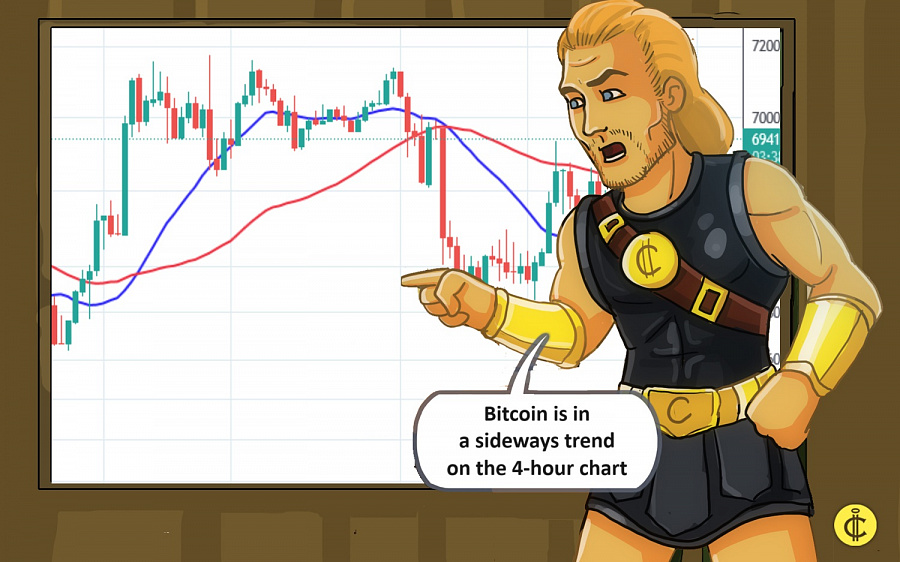
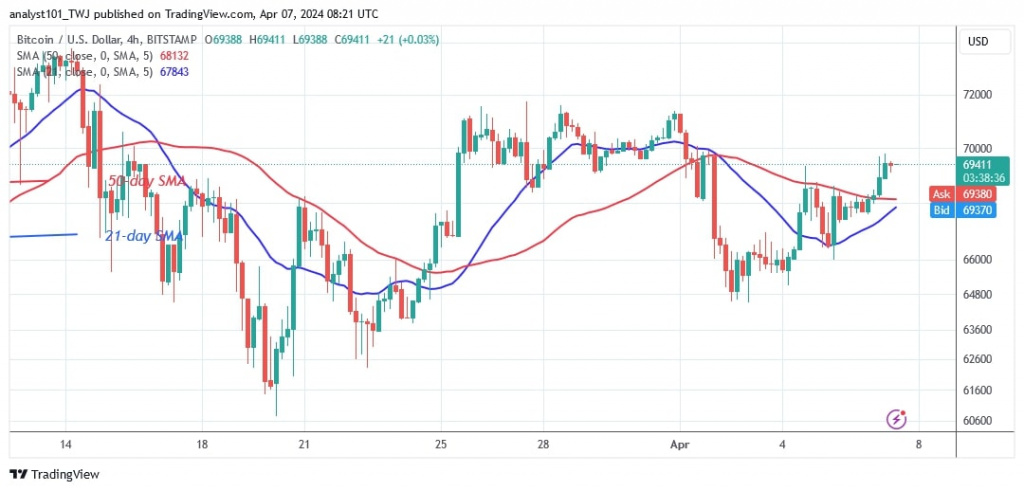
Bitcoin is in a sideways trend on the 4-hour chart. The cryptocurrency is currently trading between $64,500 and $72,000. Buyers have tried unsuccessfully three times to break through resistance at $72,000 but were beaten back. Bitcoin continued to fall below the moving average lines, although the upward correction was halted below the $70,000 high.
 Coinidol.com reported on April 4 that after the rejection, BTC was forced to move within a price range of $60,000 to $72,000.
Disclaimer. This analysis and forecast are the personal opinions of the author and are not a recommendation to buy or sell cryptocurrency and should not be viewed as an endorsement by CoinIdol.com. Readers should do their research before investing in funds.
Price
News
Price
Price
Price

(0 comments)