Bitcoin Holds Above $65,000 And Prepares For its Uptrend

The price of Bitcoin (BTC) has fallen below the 21-day SMA for the second consecutive day, indicating that the cryptocurrency is poised for another decline.
Bitcoin price long-term prediction: Bullish
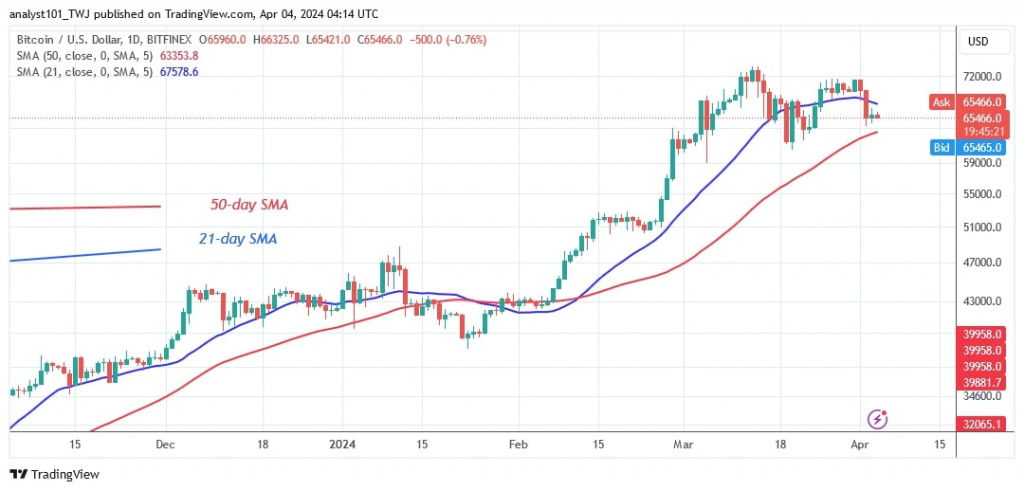
Bulls and bears have been battling over the $72,000 resistance since March 13, 2024. The bulls broke through the resistance and reached a high of $73,588 but were stopped out. After the rejection, the cryptocurrency was forced to move within a price range of $60,000 to $72,000.
At the time of writing, the value of Bitcoin stands at $65,402. The largest cryptocurrency is currently trading above the 50-day SMA support but below the 21-day SMA resistance. Bitcoin will regain positive momentum after breaking above the 21-day SMA resistance. The cryptocurrency will test its recent high of $73,588.
However, Bitcoin's value will fall if the 50-day SMA support is broken. In the meantime, Bitcoin is approaching the 50-day SMA or the $62,000 support. If the current support is broken, the selling pressure will increase again.
Bitcoin (BTC) indicator reading
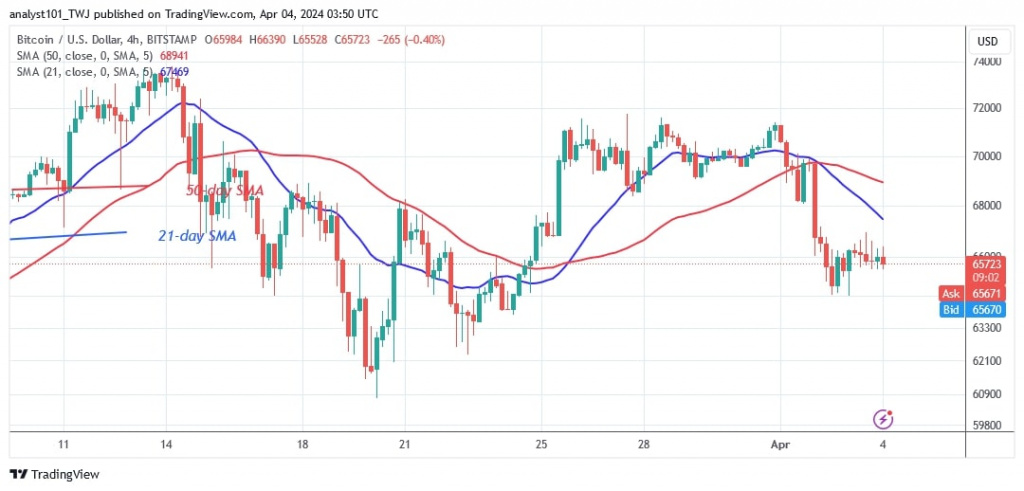
Currently, Bitcoin is trapped between the moving average lines, indicating that values may fluctuate. Despite the earlier dip, the moving averages are moving north. On the 4-hour chart, the price bars are below the moving averages, indicating a bearish crossover. A bearish crossover occurs when the 21-day SMA falls below the 50-day SMA. This gives traders the signal to place short orders.
Technical indicators:
Key resistance levels – $70,000 and $80,000
Key support levels – $50,000 and $40,000

What is the next direction for BTC/USD?
Bitcoin is currently in the middle of a price range. It is confined within the moving average lines, which makes the market's path unclear. Doji candlesticks have appeared, suggesting that the cryptocurrency is consolidating above the $65,000 support. The next direction of the market will be determined by the subsequent consolidation.

Price
Price
News
Price
Price

(0 comments)