Bitcoin Rebounds Above $54,000 Support, Revisits $60,000 High

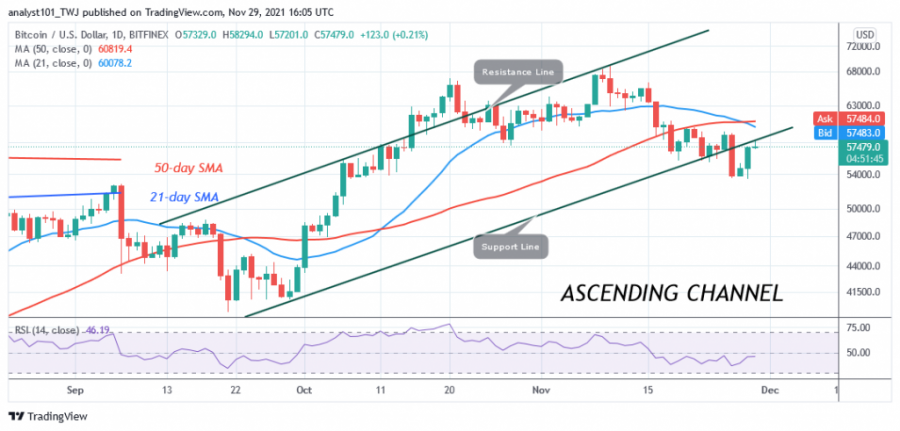
After the recent downward momentum, Bitcoin (BTC) has rallied back above the $54,000 support. On November 26, sellers pushed the price of BTC to the low of $53,555. Had the bearish momentum continued, the bitcoin price would have fallen to $51,050 or $50,000.
But on November 26, it went down. The bulls bought the dips and catapulted Bitcoin back up. Today, Bitcoin is trading at $57,569 as of press time. BTC/USD has fallen to its previous range of $55,700 to $58,000. If buyers keep BTC prices above the $58,000 resistance, the cryptocurrency will come out of the downward correction. At the same time, buyers have the advantage of regaining the previous highs of $60,000 and $64,000.
Bitcoin indicator reading
On November 26, Bitcoin recorded a bearish crossover. That is, the 21-day line crossed below the 50-day moving average, which is a sell signal. Bitcoin is at level 46 on the Relative Strength Index for period 14, and the cryptocurrency price is below the moving averages, indicating a downtrend. Bitcoin is now in bullish momentum above the 25% area of the daily stochastic.

Technical indicators:
Major Resistance Levels - $65,000 and $70,000
Major Support Levels - $60,000 and $55,000
What is the next direction for BTC?
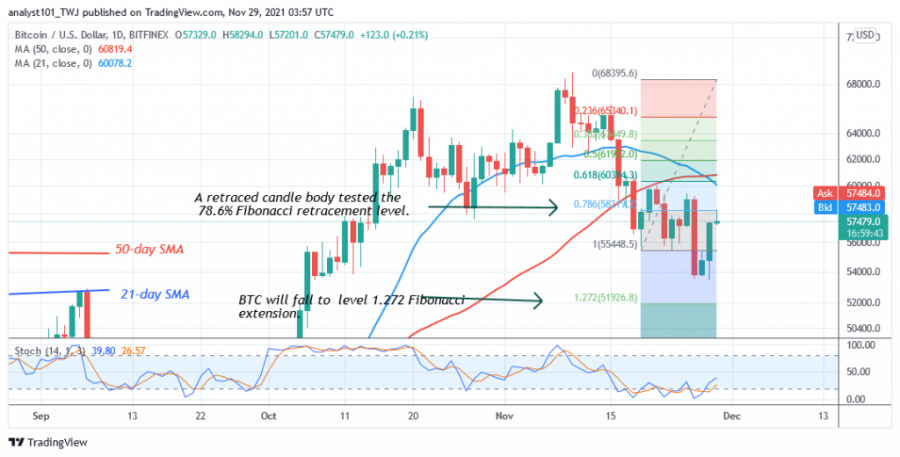
On the 4-hour chart, the price of BTC has been in a downtrend. The cryptocurrency is returning above the $54,000 support. Meanwhile, the downtrend from November 18 has shown a candlestick testing the 78.6% Fibonacci retracement level. The retracement suggests that the BTC price will fall but reverse at the 1.272 Fibonacci extension level or $51,926.

Disclaimer. This analysis and forecast are the personal opinions of the author and are not a recommendation to buy or sell cryptocurrency and should not be viewed as an endorsement by CoinIdol. Readers should do their own research before investing funds.
Coin expert
Price
Coin expert
Price
Price

(0 comments)