Bitcoin Price Sinks Below $80,000

The price of Bitcoin (BTC) has fallen sharply below $80,000. For several days BTC managed to hold above the $82,500 support level.
BTC price long-term forecast: bearish
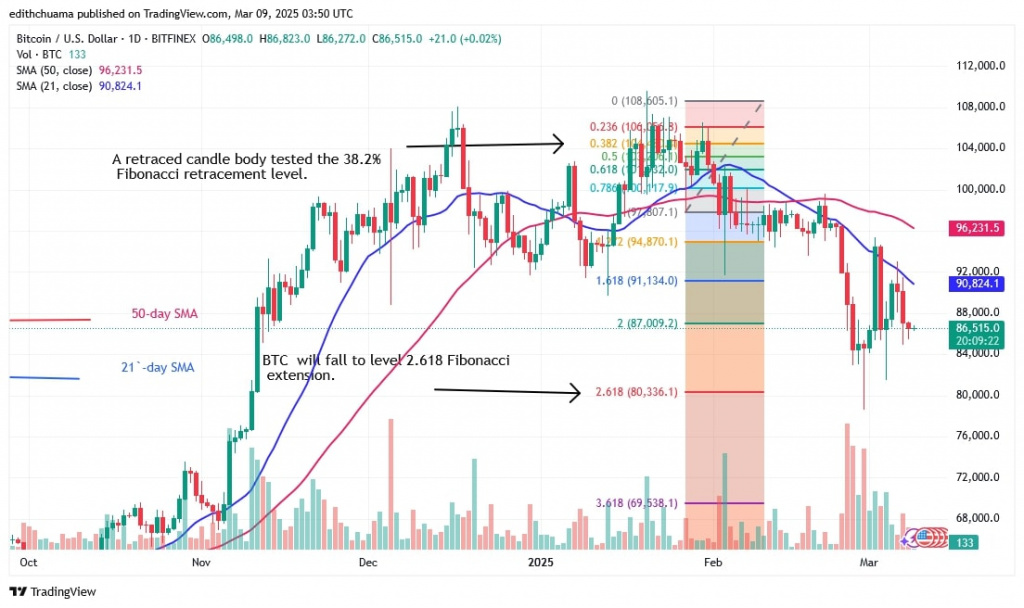
The largest cryptocurrency plunged to $78,617 on February 28, but the bulls bought the dips. The price indicator had previously predicted that the bitcoin price would fall to $80,336.10, which is the level of the 2.618 Fibonacci extension. The downtrend weakened yesterday and remained above $82,500 but below the moving average lines, before going down again.
On March 2, as reported previously by Coinidol.com, buyers again tried in vain to hold the price above the 21-day SMA. Bitcoin is currently trading in the middle of the price range after retreating. On the downside, Bitcoin price is falling but bouncing back above the $80,000 mark.
Analysis of the BTC price indicators
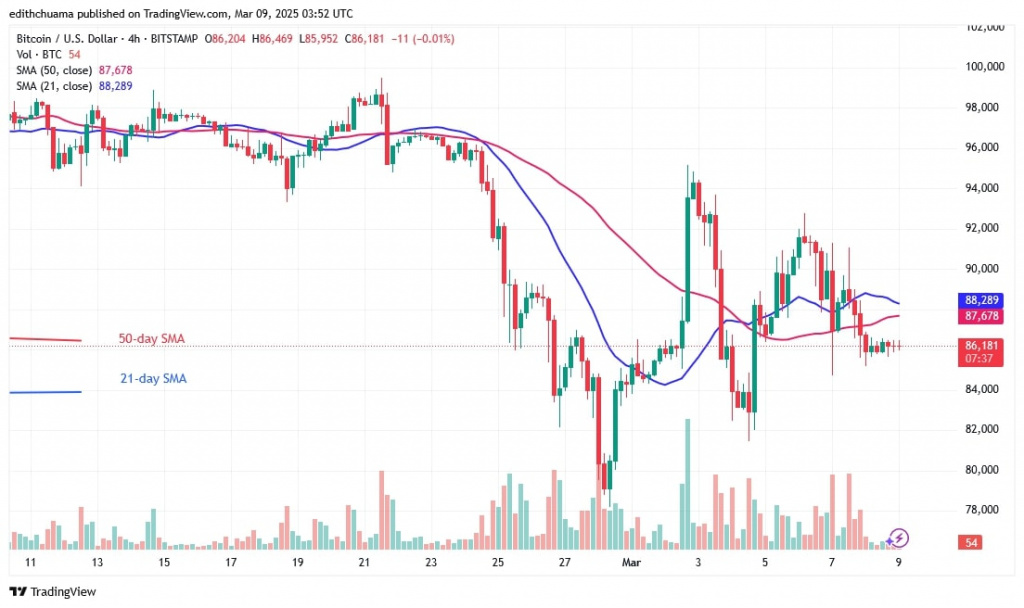
The Bitcoin price is below the moving average lines. The extended candle tails are pointing below the $80,000 support level. Strong buying pressure at the $80,000 support is indicated, while sideways movement on the 4-hour chart is indicated by the horizontal moving average lines.
Technical indicators
Key supply zones: $108,000, $109,000, $110,000
Key demand zones: $90,000, $80,000, $70,000

What is the next move for Bitcoin?
Bitcoin is trading above the $80,000 support but below the $95,000 barrier on the 4-hour chart. Meanwhile, the decline has been halted above the $85,000 support. The doji candle sticks have appeared as the Bitcoin value has consolidated above the $85,000 support.

Disclaimer. This analysis and forecast are the personal opinions of the author. They are not a recommendation to buy or sell cryptocurrency and should not be viewed as an endorsement by CoinIdol.com. Readers should do their research before investing in funds.
Price
Price
Price
Price
Price

(0 comments)