Bitcoin Price Sinks But Remains Above The $66,000 Support Level
Updated: Jun 15, 2024 at 11:59

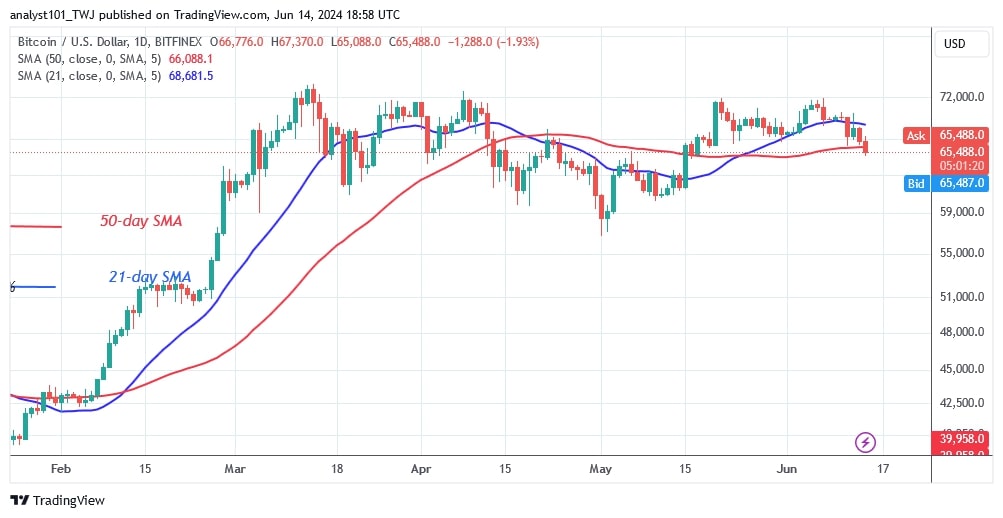
The price of Bitcoin (BTC) has fallen below the moving average lines, but the bulls are trying to stop the decline above the 50-day SMA.
Long-term forecast for the Bitcoin price: bearish
According to price analysis by Coinidol.com, the price of the cryptocurrency will fluctuate between the moving average lines if it holds above the 50-day SMA.
Nevertheless, the largest cryptocurrency risks a further decline if Bitcoin slips below the moving average lines. BTC/USD is worth $65,716 at the time of writing. On the downside, Bitcoin will fall to $60,000 if it loses the 50-day SMA support. In the meantime, the altcoin is pausing above the $65,000 support.
Bitcoin indicator reading
The price of the cryptocurrency fell below the moving average lines but recovered above the 50-day SMA. In other words, Bitcoin is between the moving average lines. Bitcoin is trading above the 50-day SMA but below the 21-day SMA. The decline has paused above the 50-day SMA.
Technical indicators:
Key resistance levels – $70,000 and $80,000
Key support levels – $50,000 and $40,000

What is the next direction for BTC/USD?
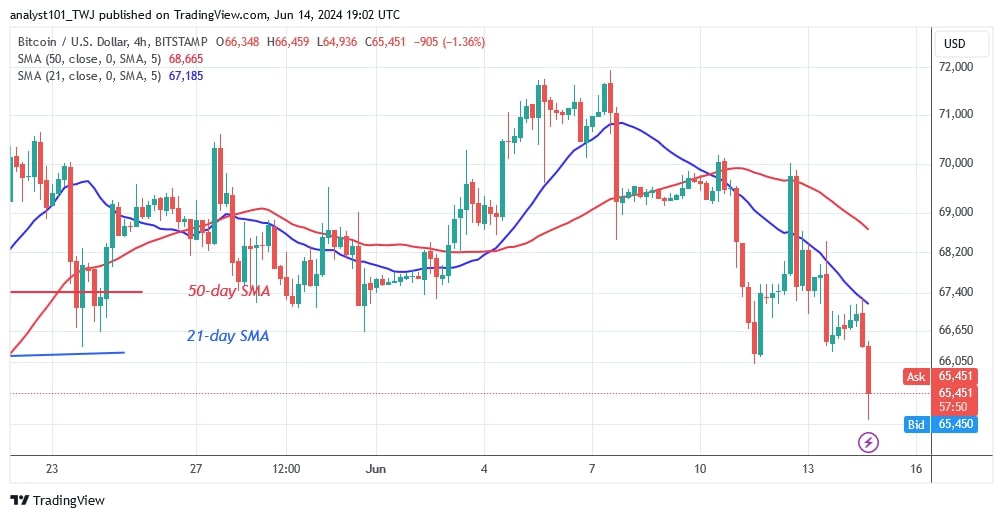
Bitcoin has slipped below the moving average lines but remained above the 50-day SMA. In other words, the BTC price fell to a low of $65,088 before recovering above the $66,000 support. On the upside, the cryptocurrency will test its previous high of $70,000 if the current support holds. The 4-hour chart of Bitcoin shows an upward correction, but there is a first obstacle at the high of $66,567.

Disclaimer. This analysis and forecast are the personal opinions of the author and are not a recommendation to buy or sell cryptocurrency and should not be viewed as an endorsement by CoinIdol.com. Readers should do their research before investing in funds.
Price
Politics
Price
Price
Price

(0 comments)