Bitcoin Price Holds Above $60,000 While Its Direction Is Uncertain
Updated: Oct 04, 2024 at 12:52

The price of Bitcoin (BTC) has fallen after failing to break through the $65,000 mark. Buyers were hoping to push Bitcoin to the psychological price of $70,000 if the $65,000 mark was breached.
Bitcoin price long-term prediction: bullish
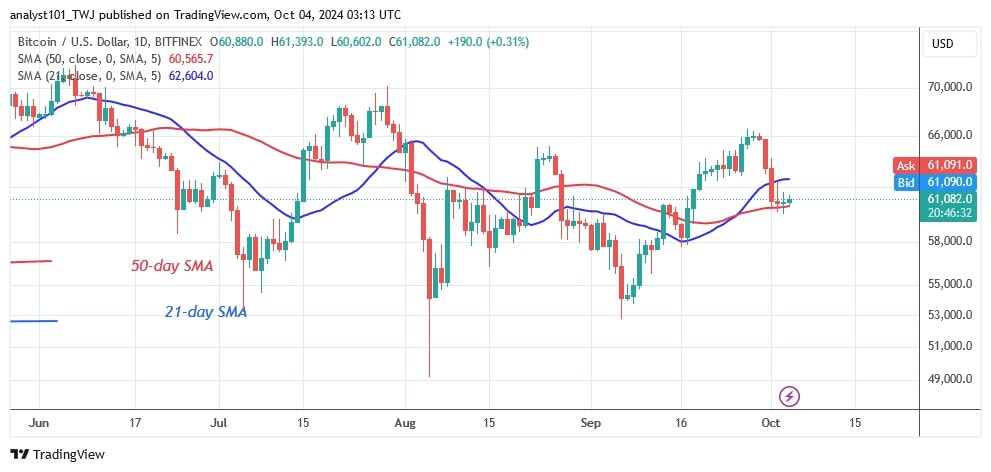
On September 29, as reported by Coinidol.com, Bitcoin had a strong rejection at a high of $66,193. Today, the largest cryptocurrency fell below the moving average lines but remained above the 50-day SMA.
Since October 1, BTC price has been fluctuating above the $60,000 low and above the 50-day SMA support. The price action has been stationary for the past three days as doji candlesticks have emerged. Doji candlesticks indicate that traders are unsure which way the market will move.
On the negative scenario Bitcoin would continue to fall if it fails to reach the 50-day SMA support or the $60,000 low. Similarly, the uptrend will begin once the bulls break the 21-day SMA resistance line. In the meantime, BTC price has remained steady between the moving average lines.
Today, Bitcoin is $61,262.
BTC indicator reading
After the drop, the Bitcoin price got stuck between the moving average lines. Buyers were unable to push the Bitcoin price above the high of $70,000. The upside momentum was halted at the $65,000 level. If the 50-day SMA support is breached, Bitcoin could fall even further.
Technical indicators:
Resistance Levels – $70,000 and $80,000
Support Levels – $50,000 and $40,000

What Is the Next Direction for BTC/USD?
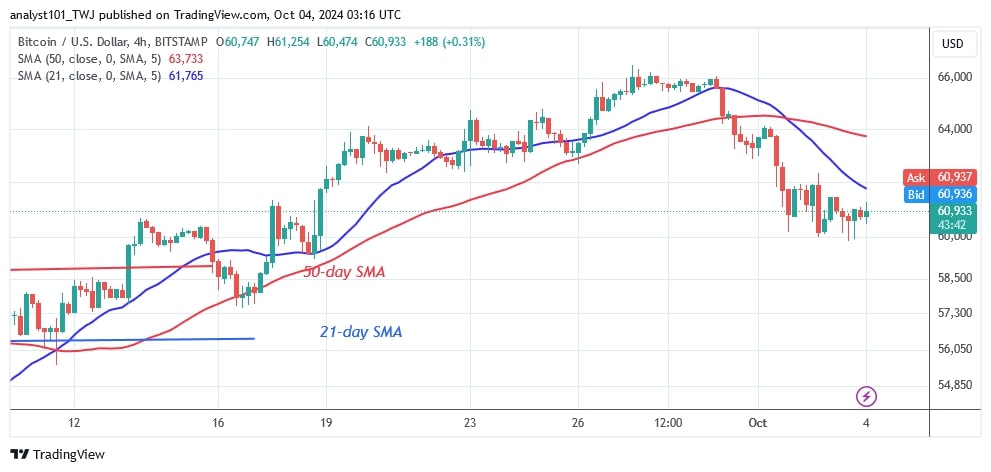
Bitcoin is falling below the moving average lines on the 4-hour chart. Since October 1, the cryptocurrency has been trading above the $60,000 support but below the moving average lines.
In the last three days, long candlestick tails have pointed to the $60,000 support. Long candlestick tails indicate significant buying pressure at lower prices.

Disclaimer. This analysis and forecast are the personal opinions of the author. They are not a recommendation to buy or sell cryptocurrency and should not be viewed as an endorsement by CoinIdol.com. Readers should do their research before investing in funds.
Price
Price
Price
Price
Politics

(0 comments)