Bitcoin Pauses Above $91,000 As Buyers Defend It
Updated: Jan 12, 2025 at 13:53

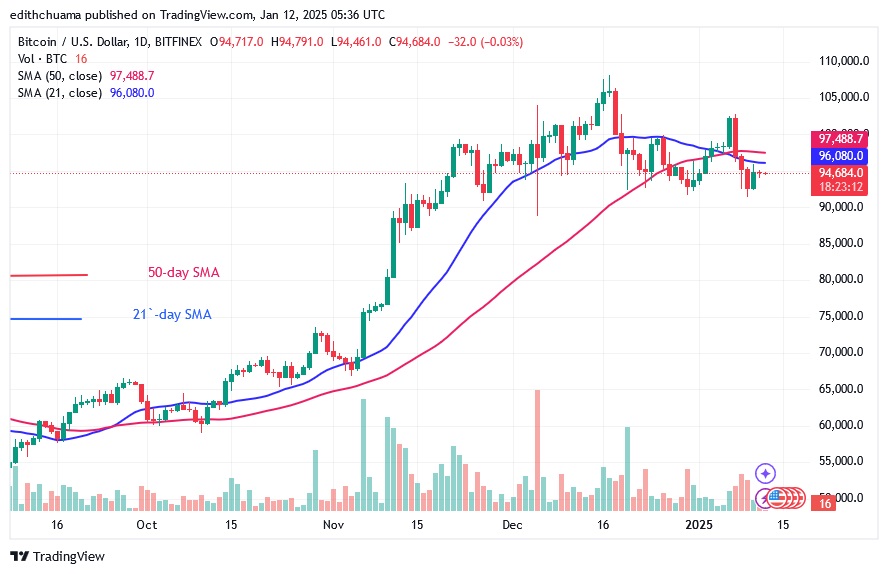
Cryptocurrency analysts of Coinidol.com report, Bitcoin (BTC) price has fallen below the moving averages for the second time.
Bitcoin price long term forecast: bearish
On December 30, 2024, Bitcoin dipped above $91,000 before rising above the moving average lines. On January 7, buyers failed to sustain the bullish momentum above the $100,000 high, leading to the decline. Today, Bitcoin is consolidating above the support level of $91,430 but below the moving average lines. Buyers are stubbornly defending the psychological price level of $90,000 as bearish momentum stalls above the $91,000 support. However, if Bitcoin loses its current support above $91,000, the bears are likely to break the $90,000 level. Bitcoin will continue to fall and reach a low of $85,000.
Nonetheless, the largest cryptocurrency will resume its positive trend once it breaks above the moving average lines. Bitcoin is currently worth $94,700.
Read Bitcoin indicators
Bitcoin has fallen below the moving average lines twice, with the price bars remaining below these lines. The moving average lines are horizontal, with a bearish crossover. The bearish crossover means that the 21-day SMA is falling below the 50-day SMA, indicating a further decline in the cryptocurrency. Meanwhile, the price decline has paused above the $91,000 level.

Technical indicators:
Key resistance levels – $90,000 and $110,000
Key support levels – $70,000 and $50,000
What is the next move for BTC/USD?
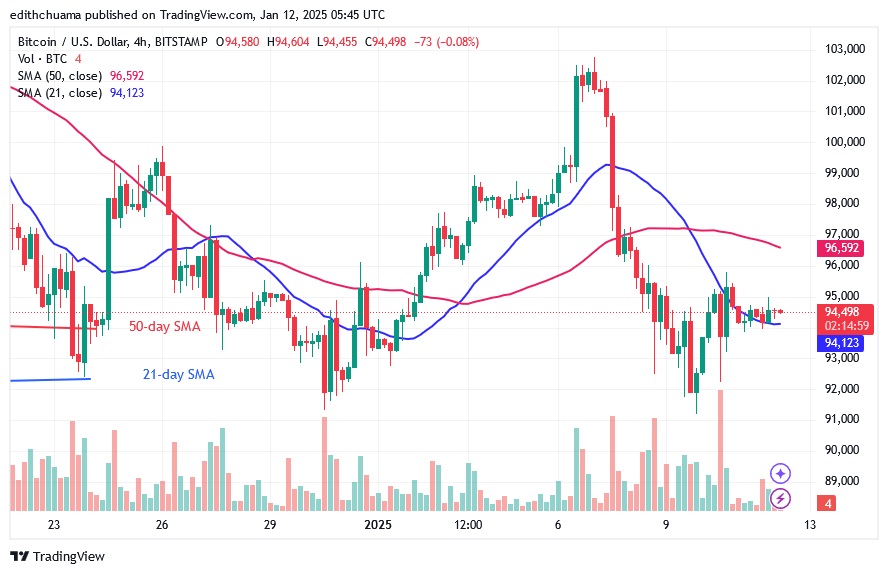
On the 4-hour chart, Bitcoin has corrected upwards but is now between the moving average lines. The price of the cryptocurrency is stabilizing above the 21-day SMA support or $94,000 but below the 50-day SMA resistance. Bitcoin is expected to stay within the moving average lines for a few days. If the bears break the 21-day SMA or the current support of $94,000, selling pressure will pick up again.

Disclaimer. This analysis and forecast are the personal opinions of the author. They are not a recommendation to buy or sell cryptocurrency and should not be viewed as an endorsement by CoinIdol.com. Readers should do their research before investing in funds.
Price
News
Price
Price
News

(0 comments)