Bitcoin Makes A Strong Attempt To Recapture The $40,000 Level
Updated: Nov 09, 2023 at 12:44

The Bitcoin (BTC) price has made another excellent push to this years highs, breaking through the $36,000 resistance level. Price analysis from Coinidol.com.
Bitcoin (BTC) Price Long Term Prediction: Bullish
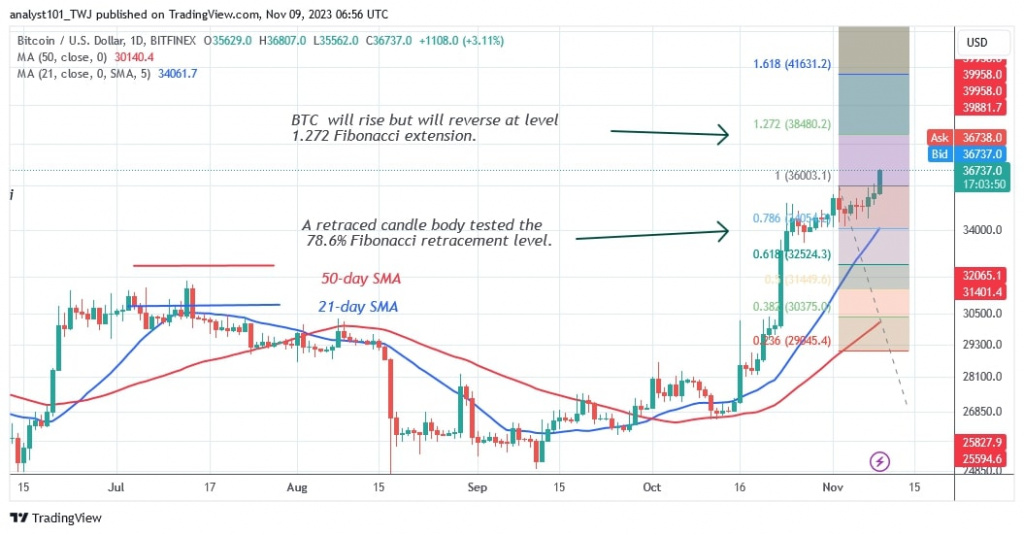
Bitcoin has been trading in a range between $34,000 and $36,000 for the past two weeks as buyers prepare for a possible upward impulse. Today, buyers have surpassed the recent high, with the cryptocurrency reaching a high of $36,746.
Analysts expect Bitcoin to rise to a high of $40,000 if current resistance levels are broken. However, the price indication says otherwise. A retraced candlestick body at the November 2 rally tested the 78.6% Fibonacci retracement line. The retracement suggests that BTC would rise at the 1.272 Fibonacci extension level of $38,480.20 but then reverse. The upward momentum continues as the cryptocurrency approaches the $37,000 mark.
Technical indicators:
Key resistance levels – $30,000 and $35,000
Key support levels – $20,000 and $15,000

Bitcoin (BTC) Indicator Reading
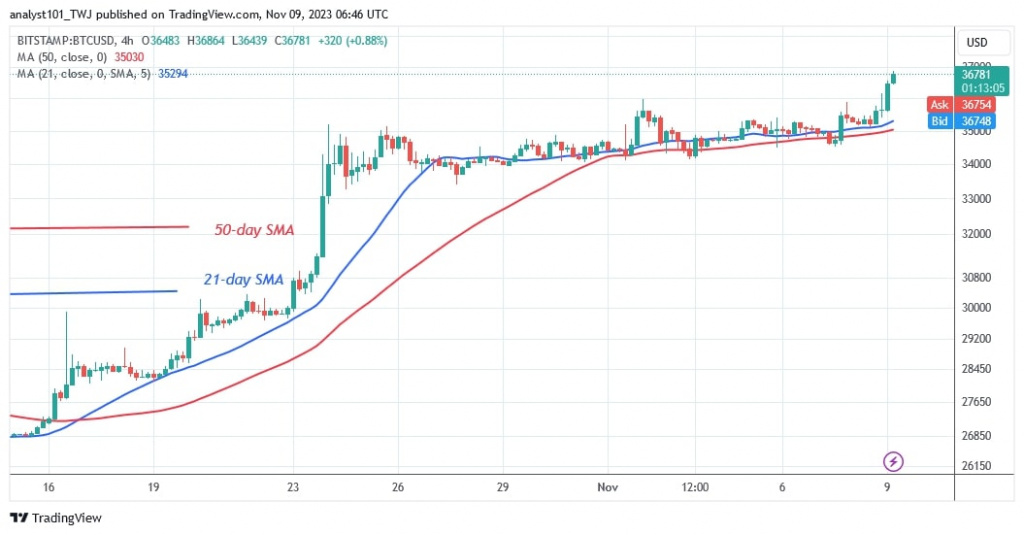
The price bars and moving average lines on the 4-hour chart were horizontally flat due to the sideways trend. In addition, the price bars are characterised by Doji candlesticks that initiate a move within the trading range.
Today, November 9th, the consolidation phase is over and the Bitcoin price has returned to previous highs. The horizontal moving average lines will almost certainly trend upwards.
What Is the Next Direction for BTC/USD?
Bitcoin price has resumed its uptrend after the bulls broke through the barrier level. The bulls have broken the initial barrier at $35,975 but have not yet reached the high at $37,000. A further uptrend is possible if the Bitcoin price remains above the support at $36,000.
On November 2, BTC reached a new high of $35,975 before falling back into the range bound zone as reported before.

Disclaimer. This analysis and forecast are the personal opinions of the author and are not a recommendation to buy or sell cryptocurrency and should not be viewed as an endorsement by CoinIdol.com. Readers should do their research before investing in funds.
Price
Price
Price
Price
News

(0 comments)