Bitcoin Loses Important Support At $66,000 And Starts To Fall
Updated: Apr 14, 2024 at 09:46

The uptrend of the Bitcoin (BTC) price has come to an end as it has dipped below the moving average lines. BTC price analysis by Coinidol.com.
Long-term forecast for the Bitcoin price: bearish
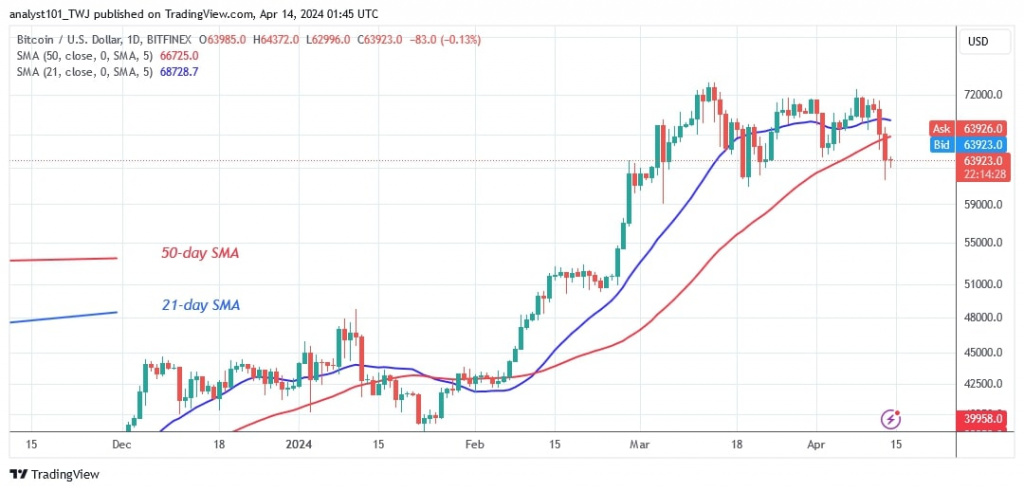
The price of the cryptocurrency has been pushed away from the $72,000 barrier zone. Since March 14, the largest cryptocurrency has been trading in a sideways trend, hovering between $66,000 and $72,000 in anticipation of a bull market. Buyers made several futile attempts to resume the uptrend but were rebuffed.
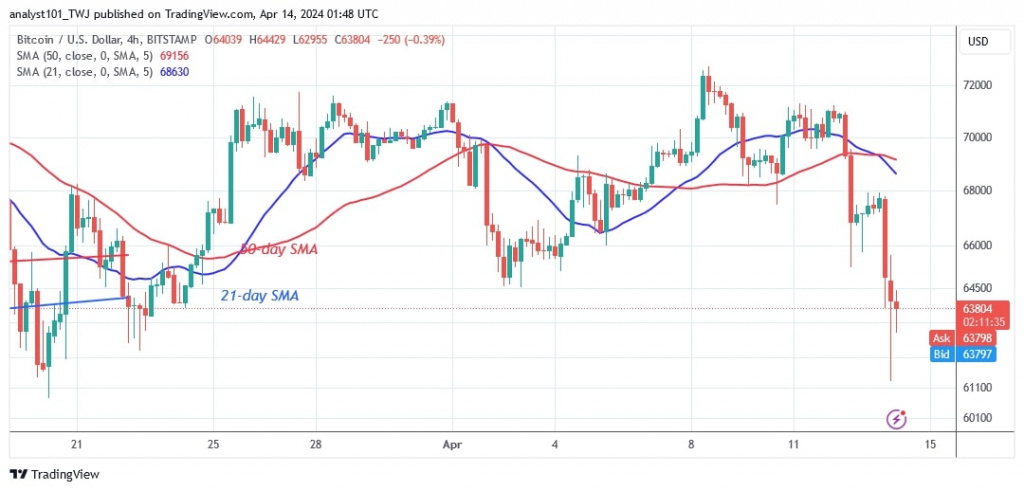
Bitcoin fell considerably to a low of $61,593 as bulls bought dips. Selling pressure will continue as Bitcoin falls below the 50-day SMA. Bitcoin will fall to a low of 60,000. However, if the bears break the $60,000 support, the cryptocurrency would fall to lows of $57,000 and $54,000. Meanwhile, Bitcoin is worth $64,109 at the time of writing.
Bitcoin indicator reading
After the recent drop, BTC price bars have fallen below the moving average lines. The selling pressure will continue as long as the price bars remain above the moving average lines. On the 4-hour chart, the price bars have dropped significantly, indicating a bearish trend. The 21-day SMA is below the 50-day SMA, indicating a downtrend.
Technical indicators:
Key resistance levels – $70,000 and $80,000
Key support levels – $50,000 and $40,000

What is the next direction for BTC/USD?
Bitcoin is now falling below the moving average lines. The largest cryptocurrency fell from its previous highs at $72,000 and $61,593. The bulls bought the dips, but the upside correction ended at a high of $68,000. The decline has started slightly to the downside.
Coinidol.com reported previously that if Bitcoin rises above the 21-day SMA or the $70,000 support, the resistance levels of $72,762 and $73,666 will be breached.

Disclaimer. This analysis and forecast are the personal opinions of the author and are not a recommendation to buy or sell cryptocurrency and should not be viewed as an endorsement by CoinIdol.com. Readers should do their research before investing in funds.
Price
Price
News
Price
Price

(0 comments)