Bitcoin Trades Above $26,000 Support In A False Breakout

The price of Bitcoin (BTC) has consistently held above the $26,000 psychological support. Bitcoin price analysis from Coinidol.com.
Bitcoin (BTC) Price Long Term Forecast: Bearish
The largest cryptocurrency fell back above $26,000 after a price rally on September 27 and managed to reach $27,000 by the end of September 28.
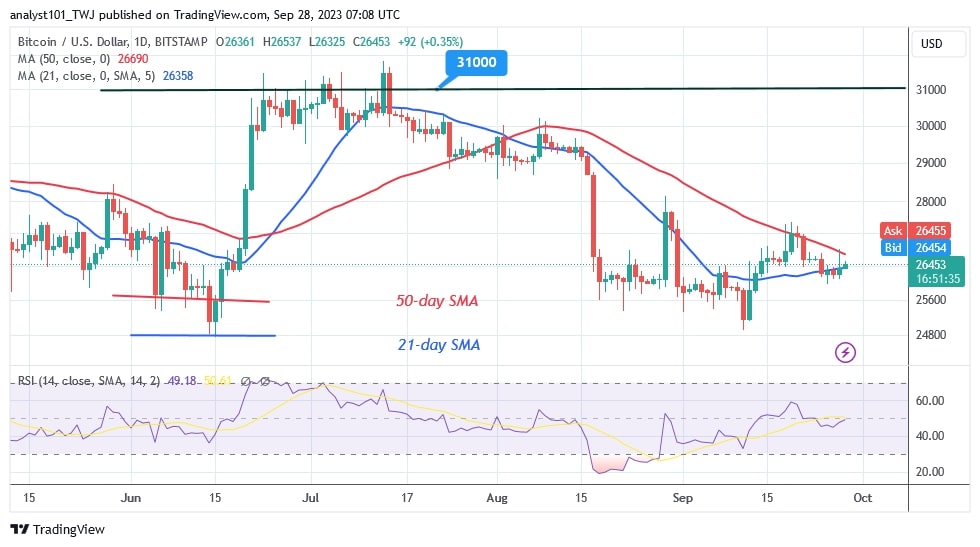
The price rise reached the resistance level of $26,800 before falling above the existing support. On the positive side, the BTC price is facing challenges in the overbought area of the market. Moreover, buyers failed to keep the price above the 50-day line SMA.
Bulls will conquer resistance levels in a market that is trending strongly. In a market that is in a strong trend, an overbought condition cannot last.
However, the BTC price has been fluctuating between $25,000 and $27,000 since August 18. However, due to the overbought condition of the market, buyers have not been able to sustain the upward momentum above the recent high.
Technical Indicators:
Key resistance levels – $30,000 and $35,000
Key support levels – $20,000 and $15,000

Bitcoin (BTC) Indicator Display
After the price rise, Bitcoin is currently trading in the bearish trend zone. For the period 14, it is at the level 48 of the Relative Strength Index. While buyers are trying to keep the price above the 21-day line SMA, the price of the cryptocurrency is just below the moving average lines. The daily chart's stochastic is at 40, marking the end of the bullish momentum. As a result, the price of the cryptocurrency is falling from its recent high.
What's next for BTC/USD?
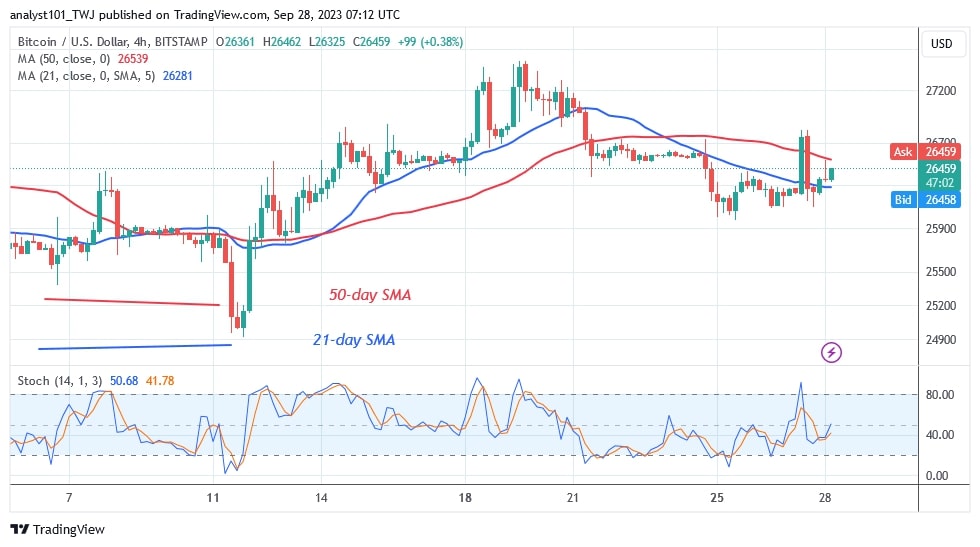
After the recent rally, the BTC price is currently trading just above the $27,000 support level. The cryptocurrency price is trapped between the moving average lines on the lower time frame. The rising movement is rejected either at the 50-day line SMA or the high at $26,600. In other words, the BTC price might be forced to move within the limited range.

Just a week ago, Coinidol.com reported that the bitcoin price returned to a downtrend after failing to maintain upward momentum above the moving average lines.
Disclaimer. This analysis and forecast are the personal opinions of the author and are not a recommendation to buy or sell cryptocurrency and should not be viewed as an endorsement by CoinIdol.com. Readers should do their research before investing in funds.
News
Price
Coin expert
News
Coin expert

(0 comments)