Bitcoin Holds Firm Above $60,000 And Continues Its Range

The price of Bitcoin (BTC) has held above the psychological price level of $60,000 since the price drop on April 13, 2024.
Bitcoin price long-term forecast: bearish
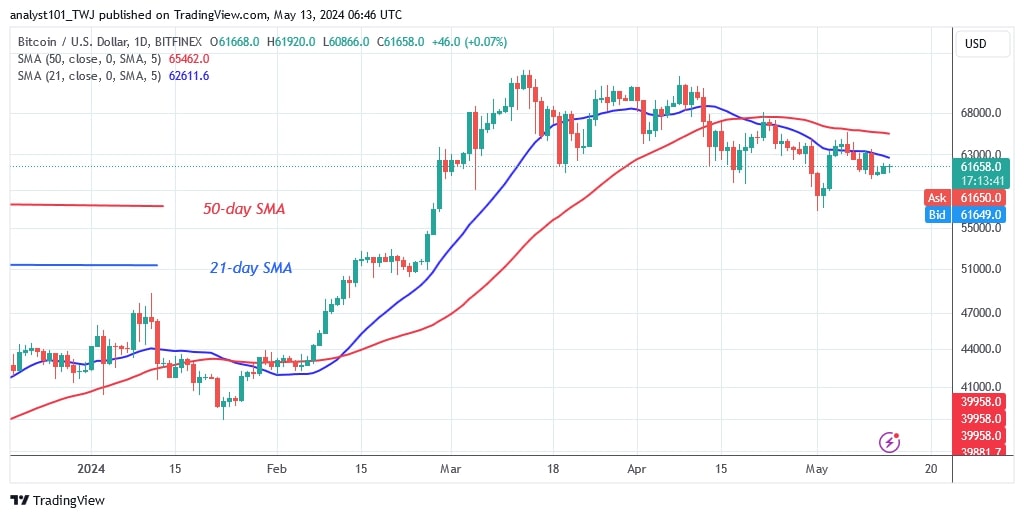
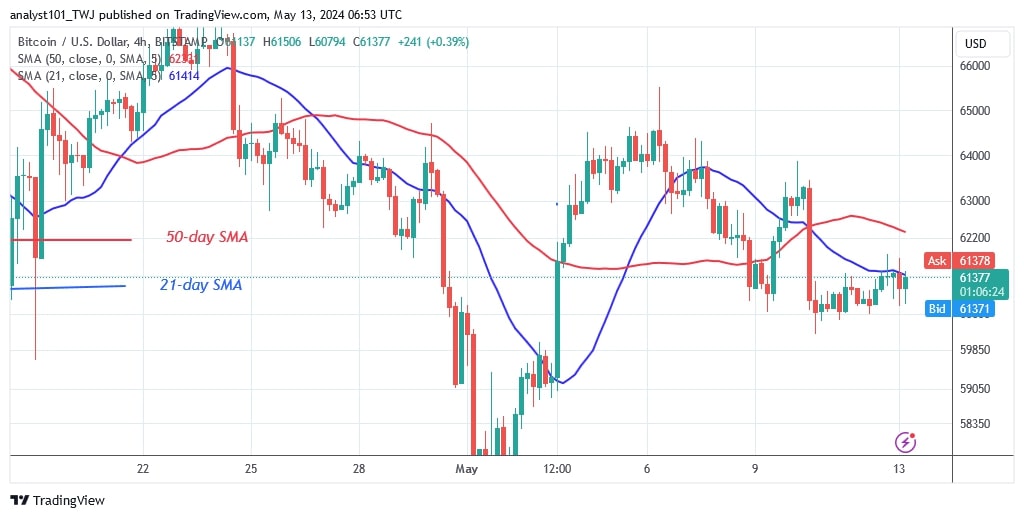
Bulls are buying every dip to stay above the $60,000 support level. However, buyers have failed to keep the price above the moving averages over the past month. Any price rise above the 21-day SMA was stopped by the moving average lines. On May 10, the largest cryptocurrency retested the 21-day SMA and Bitcoin fell sharply to a low of $60,184. The bulls bought the dips as the market continued its uptrend.
On the upside, Bitcoin will resume its uptrend if buyers keep the price above the 50-day SMA or the barrier at $65,562. At the time of writing, Bitcoin is currently worth $61,819.
Bitcoin indicator reading
The moving average lines are still showing bearish crossovers as Bitcoin is holding above the current support. The 21-day SMA has continued to fend off further upward price movement. The uptrend will start when the price bars rise back above the moving average lines.
Technical indicators:
Key resistance levels – $70,000 and $80,000
Key support levels – $50,000 and $40,000

What is the next direction for BTC/USD?
Bitcoin is correcting higher as it retests the 21-day SMA resistance. If the recent high is surpassed and the uptrend continues, BTC price could reach the 50-day SMA high. Nonetheless, the cryptocurrency will maintain its range above the $600 support and below the moving average lines, with the 21-day SMA remaining unbroken.

Disclaimer. This analysis and forecast are the personal opinions of the author and are not a recommendation to buy or sell cryptocurrency and should not be viewed as an endorsement by CoinIdol.com. Readers should do their research before investing in funds.
News
Price
Price
Price
Price

(0 comments)