Bitcoin Rises Before Falling Back From The $107,250 Mark
Updated: Jun 17, 2025 at 19:17

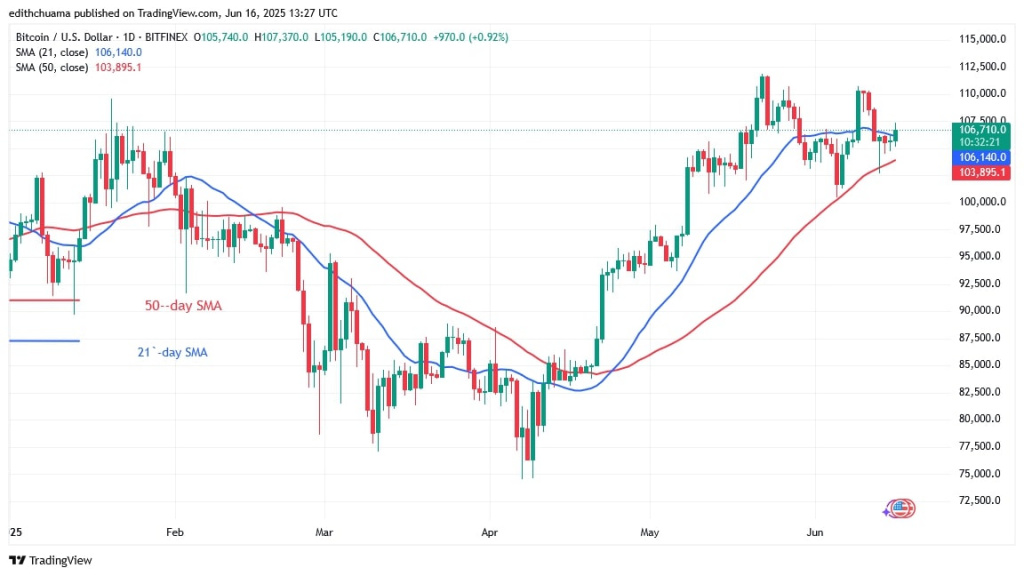
The price of Bitcoin (BTC) has risen above the moving average lines twice after falling below the 21-day SMA level.
Bitcoin price long-term prediction: bullish
It recovered after the 50-day SMA halted the bearish momentum twice. Bitcoin's price would have fallen to $100,000 if the bears had broken the 50-day SMA support. Bearish momentum will continue to decline to $92,000.
Bitcoin price is likely to rise if the 21-day SMA support holds. The crypto price is expected to rise to its previous high of $110,000 and then to $111.690.
Bitcoin price is currently at $104,826
BTC price indicator analysis
The price of the cryptocurrency has recovered above the 21-day SMA support and is now above the moving average lines. The moving average lines are higher but sloping horizontally due to the sideways trend.
Technical indicators
Key supply zones: $108,000, $109,000, $110,000
Key demand zones: $90,000, $80,000, $70,000

What is the next move for BTC?
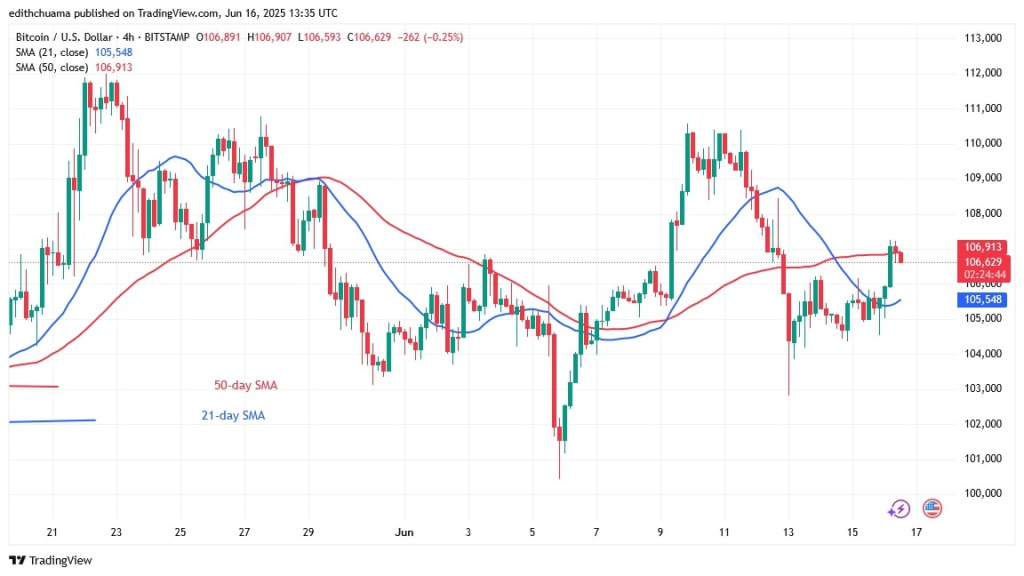
Bitcoin is currently moving sideways on the 4-hour chart after the uptrend was halted at the high of $110,000. The cryptocurrency is currently trading below the $110,000 level and above the $104,000 support.
The uptrend has hit an early obstacle at its high of $107,250 and fell back. BTC will start its uptrend on the daily chart if it stays above the 21-day SMA support.

Disclaimer. This analysis and forecast are the personal opinions of the author. They are not a recommendation to buy or sell cryptocurrency and should not be viewed as an endorsement by CoinIdol.com. Readers should do their research before investing in funds.
Price
Price
Price
Price
Price

(0 comments)