Bitcoin Continues Gradual Slide as $8000 Becomes Formidable Resistance

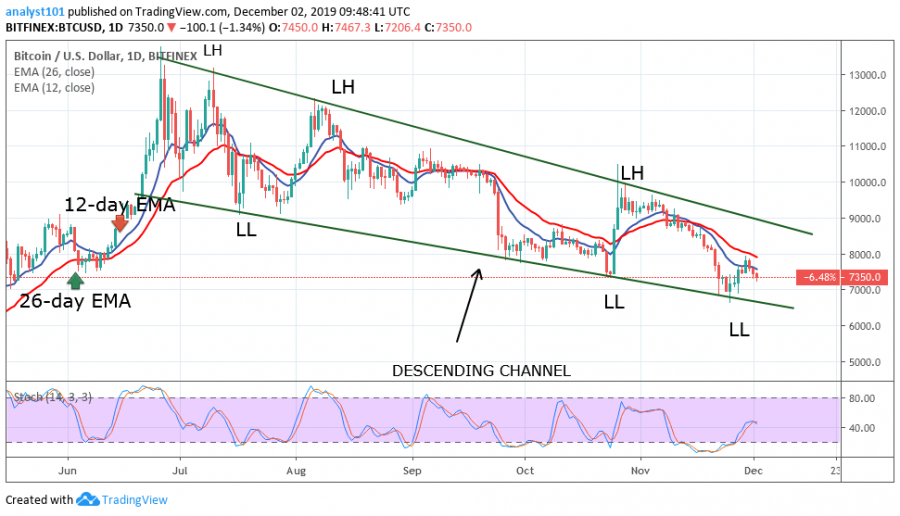
The coin has continued to fall to a bullish falling wedge pattern. The price pattern widens from the top, and contracts as Bitcoin continues its downtrend. As Bitcoin falls and slopes down, this pattern may eventually reverse the current trend. Three days ago, the pair reached a high of $7,800 and began another downward move.
The downtrend will go on if the coin falls and breaks below the support at $6,800. Alternatively, Bitcoin will rise to complete the price pattern. Nevertheless, the current downtrend may continue until the coin achieves a bullish breakout.
Bitcoin Indicator Reading
The EMAs are sloping southward indicating the price pattern. The current bullish momentum is diminishing as the coin commences another downtrend.

Key Supply Zones: $10,000, $11,000, $12,000
Key Demand zones: $7, 000, $6, 000, $5,000
What Is the Next Direction for BTC/USD?
Bitcoin may continue to move southward but a bullish breakout is expected at the end of the price pattern. We expect the market to reach the lower lows and consolidate before the bullish breakout. BTC is currently falling after testing the exponential moving average. Any attempt by price to breach the support line will result in further depreciation.
Disclaimer. This analysis and forecast are the personal opinions of the author are not a recommendation to buy or sell cryptocurrency and should not be viewed as an endorsement by CoinIdol. Readers should do their own research before investing funds.
Price
Price
Price
Price
Price

(0 comments)