Bitcoin is in a Range Bound Move, Fighting Resistance at $39,000

Bitcoin (BTC) price is in a downward correction as the largest cryptocurrency struggles below the moving averages.
Bitcoin (BTC) price long term forecast: bullish
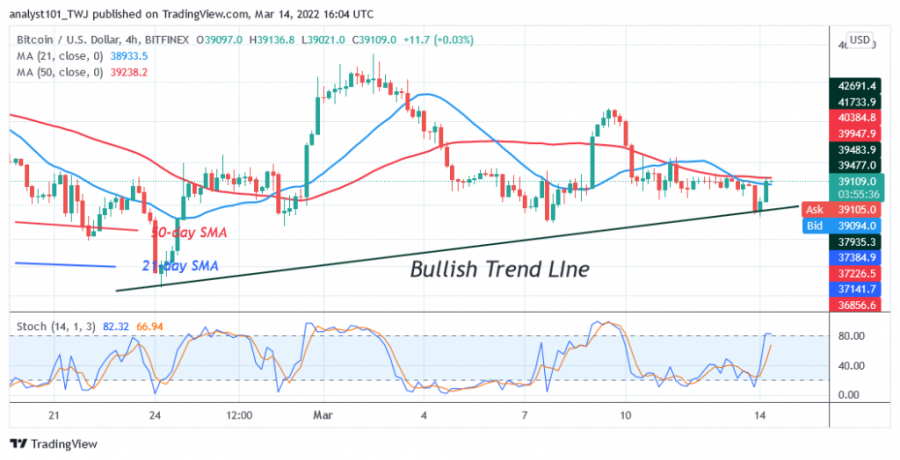
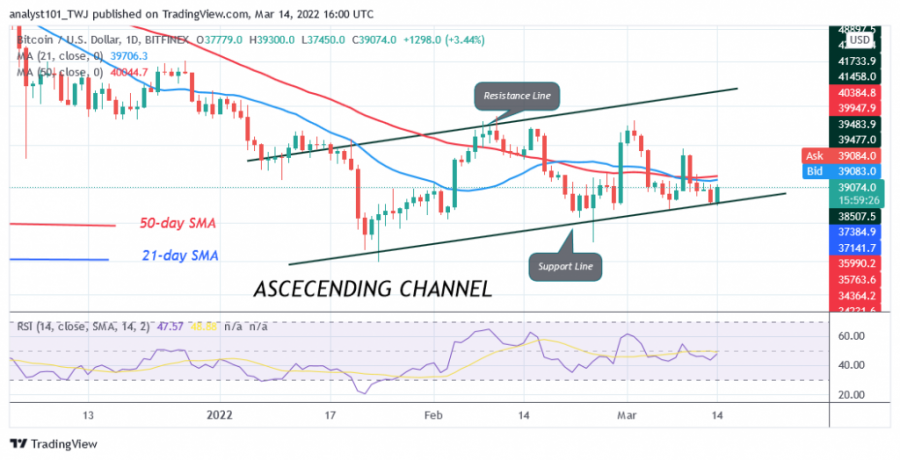
Today, buyers are trying to keep the price above the moving averages, which they have failed to do since February 28. For the past four days, the price of BTC has been struggling below the moving averages. A break above the moving averages will push Bitcoin higher and reach the high at $42,000. The bullish momentum will push Bitcoin to regain the overhead resistance at $45,000. However, if Bitcoin price fails the moving averages, the market will fall to the low of $37,000. However, if Bitcoin loses the support at $37,000, BTC/USD will continue to fall to the lower region of $36,000 or $34,000. Meanwhile, Bitcoin has reached a high of $39,018 as of press time.
Bitcoin (BTC) indicator reading
Bitcoin is at level 47 of the Relative Strength Index for period 14, and the BTC price has fallen below the center line 50. The largest cryptocurrency risks further decline if it meets resistance at the moving averages. Bitcoin is above the 80% range of the daily stochastic. This means that the market is approaching the overbought zone. This is likely to affect the current upward movement of BTC prices. Sellers will show up in the overbought region and push prices down.

Key resistance levels - $65,000 and $70,000
Key support levels - $60,000 and $55,000
What is the next direction for BTC/USD?
BTC/USD is in a fluctuation range between $37,050 and $40,200 price levels. Since March 10, the BTC price has been forced to trade in a narrow range as buyers face strong resistance at the recent high. The price action is also characterized by doji candlesticks, which consist of small indecisive bodies. The doji candlesticks indicate that buyers and sellers are undecided about the direction of the market.

Disclaimer. This analysis and forecast are the personal opinions of the author are not a recommendation to buy or sell cryptocurrency and should not be viewed as an endorsement by CoinIdol. Readers should do their own research before investing funds.
Coin expert
News
Coin expert
News
Coin expert

(0 comments)