Bitcoin Crosses The $100,000 Mark Again But Traders Remain Uncertain

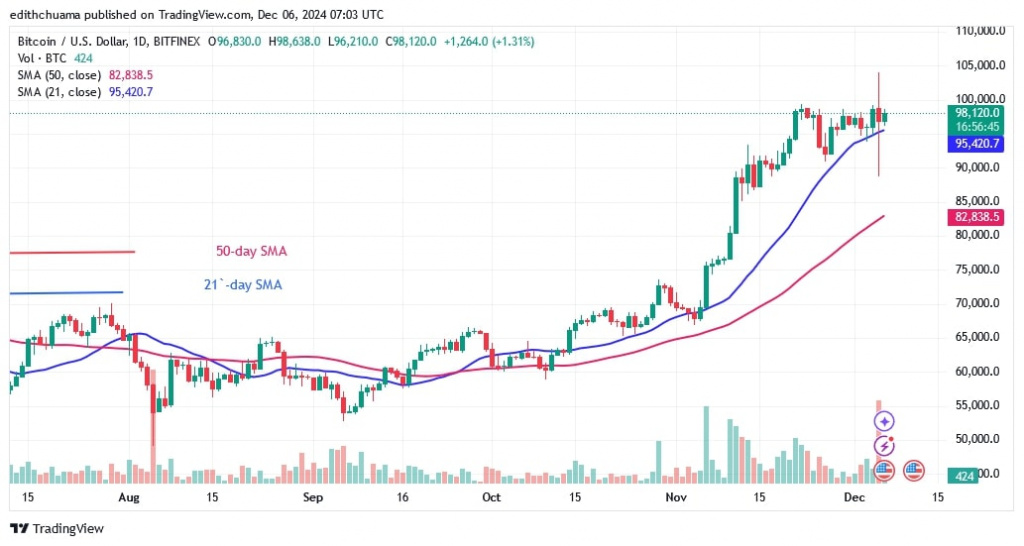
The price of Bitcoin (BTC) surpassed the psychological $100,000 mark, reaching a high of $104,000 on December 5.
Bitcoin price long-term prediction: bullish
Buyers were unable to sustain their bullish momentum above the $105,000 barrier zone after being heavily rebuffed. The largest cryptocurrency fell sharply and hit a low of $88,800, but the bulls bought the dips.
Today, Bitcoin has risen above the moving average lines. The cryptocurrency is trading above the 21-day SMA but below the $100,000 resistance level. Neither the bulls nor the bears have broken above the range level. Bitcoin is trading within a range as traders are unsure which way the market will move. However, the bulls have an advantage as Bitcoin is trading in a positive trend zone.
If buyers keep the price above $100,000 and the uptrend continues, the market will reach a high of $115,000. In the meantime, the value of Bitcoin stands at $98,707.
Bitcoin indicator reading
Doji candlesticks have returned as Bitcoin trades within a narrow range. The extended wick and tail of the candlestick indicate significant buying and selling pressure at the respective levels. The price bars are above the moving average lines, indicating a possible rise in Bitcoin.
Technical indicators:
Resistance Levels – $100,000 and $120,000
Support Levels – $80,000 and $60,000

What is the next direction for BTC/USD?
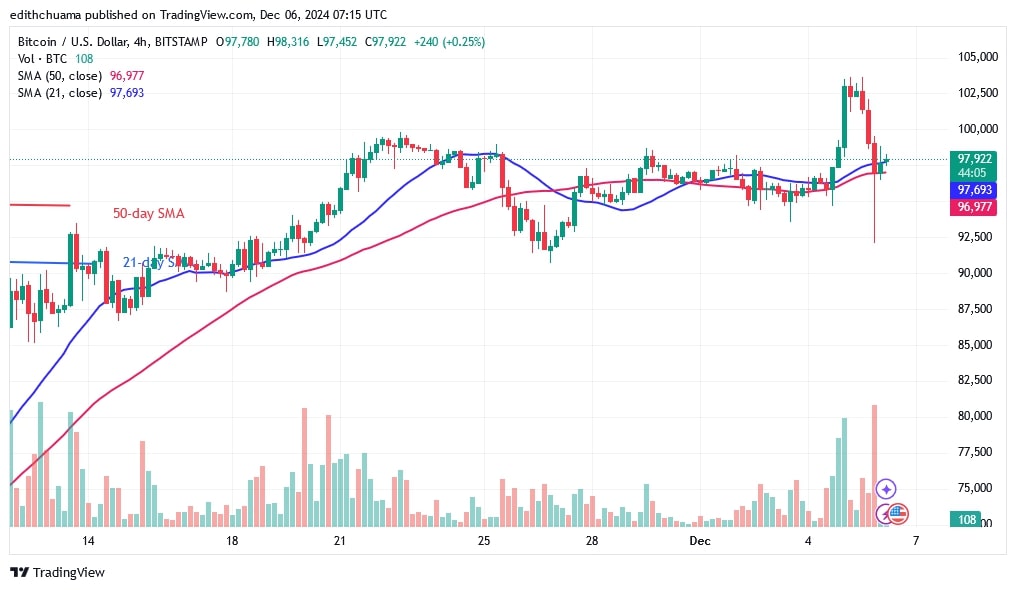
Bitcoin is in a sideways trend on the 4-hour chart after failing to break through the $100,000 high. The price bars are contained within a range as the price of the cryptocurrency moves below and above the moving average lines. The tiny, hesitant candlesticks are slowing the price movement as traders are uncertain about the market direction.

Disclaimer. This analysis and forecast are the personal opinions of the author. They are not a recommendation to buy or sell cryptocurrency and should not be viewed as an endorsement by CoinIdol.com. Readers should do their research before investing in funds.
Price
Price
Price
Price
News

(0 comments)