Bitcoin Consolidates in a Tight Range within a Striking Distance to $12k
Updated: Aug 17, 2020 at 12:10

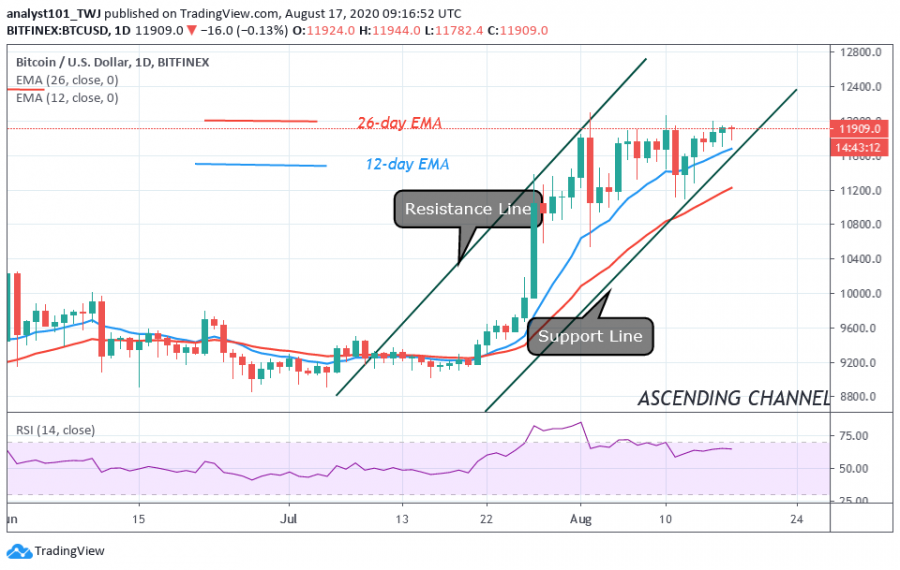
Bitcoin bulls have been consistently trading above $11,800 for the past three days. After August 15, an unsuccessful attempt to break the resistance resulted in a tight price range.
Buyers are now consolidating at а close range between $11,700 and $11,950 to break the overhead resistance. The market has been relatively stable in the current range as buyers sustain the upside range trading. BTC can break out of this range since it is close to the resistance zone.
Nonetheless, since August 13, the $11,700 support has held. The upside range will continue to unfold as long as the $11,700 support holds. Conversely, if the bears break below $11,700 support, the market will resume a downward move. This will invalidate the upside momentum. Nonetheless, the bullish scenario will resume if price falls and finds support above $11,100 or $11,250. In the interim, BTC is trading above $11,800 at the time of writing.
Bitcoin indicator reading
The king coin is trading at level 63 of the RSI period 14. This indicates that the crypto is in the uptrend zone and that price will continue to rise. BTC price will continue to rise as price bars are above the EMAs. The EMAs are sloping northward symbolizing the uptrend.
 [PICTURE]
Key Resistance Zones: $10,000, $11,000, $12,000
Key Support Zones: $7,000, $6,000, $5,000
What is the next direction for BTC/USD?
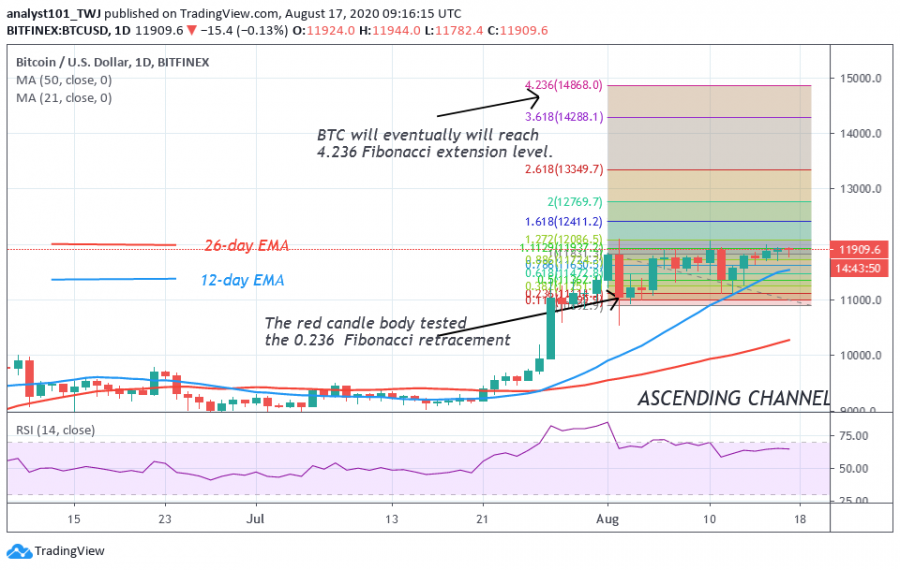
The bullish scenario for the Fibonacci tool remains the same as we await the breaking of the $12,000 overhead resistance. The tool has indicated that BTC will rise to $15,000 high. A red candle body tested the 0.236 or 23.6% Fibonacci retracement level. That is the 0.236 retracement level gives birth to 4.236 extension level. Similarly, the 4.236 Fibonacci extension level produces the recent price level. In other words, BTC will reach a high of $15,000 price level.

Disclaimer. This analysis and forecast are the personal opinions of the author that are not a recommendation to buy or sell cryptocurrency and should not be viewed as an endorsement by CoinIdol. Readers should do their own research before investing funds.
News
Price
News
Price

(0 comments)