Bitcoin Circles Above $28,000 And Targets Recent High

Cryptocurrency price analysis brought by Coinidol.com. The Bitcoin (BTC) price has been steadily declining after its recent breakout on October 16.
Bitcoin price long-term forecast: bullish
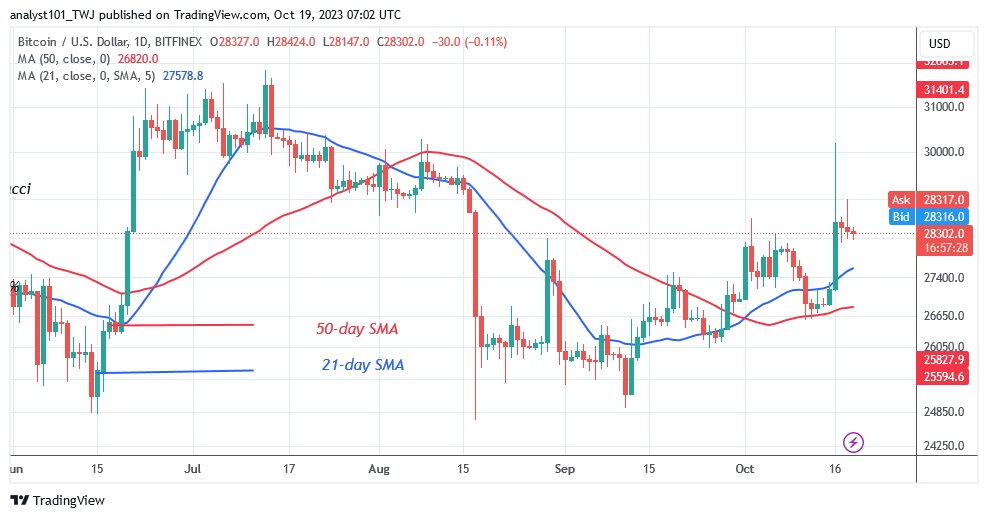
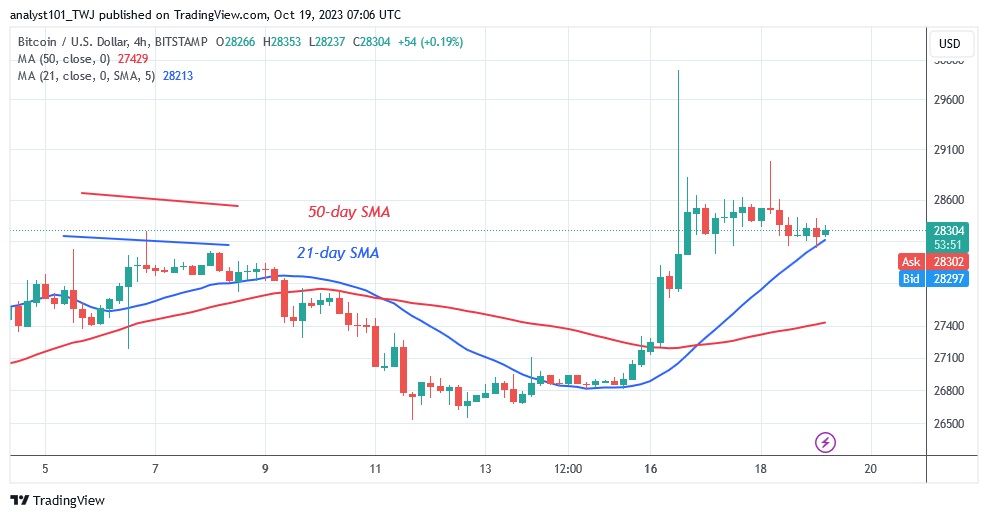
Previously, the Bitcoin value was trapped between the moving average lines. On October 16, the cryptocurrency price broke through the 21-day simple moving average and began an upward movement. The bullish momentum broke through the resistance at $28,600 and rose above the psychological price level of $30,000. After reaching the $30,000 high, Bitcoin fell dramatically and is now trading below the $28,600 resistance level.
Nonetheless, the long candle from October 16 suggests that there is significant selling pressure at the higher price level. Bitcoin was similarly rejected on August 29 and October 1. The BTC price is returning to the moving average lines to the downside. If the BTC price falls below the 50-day line SMA, the downtrend will resume. Bitcoin will first fall to the critical support above $26,000.
Bitcoin indicator display
The cryptocurrency price is currently above the moving average lines, while Bitcoin is moving above these lines. As long as the price bars are above the moving average, the cryptocurrency asset is trading in a bullish trend zone. The BTC price is capable of retesting the $28,600 level and breaking through it. However, the bullish scenario will become worthless if the price falls below the moving average lines.

Technical indicators:
Key resistance levels – $30,000 and $35,000
Key support levels – $20,000 and $15,000
What is the next direction for BTC/USD?
Buyers are trying to regain the $30,000 psychological price barrier for the largest cryptocurrency. Bitcoin last reached a high of $30,000 on August 8 before falling back to the previous low. Currently, if Bitcoin stays above the moving average line, the uptrend will resume.

On October 16, 2023 cryptocurrency analytics specialists of Coinidol.com stated that Bitcoin has been trapped between the moving average lines since October 11. Bitcoin price rallied today after breaking above the 21-day simple moving average line.
Disclaimer. This analysis and forecast are the personal opinions of the author and are not a recommendation to buy or sell cryptocurrency and should not be viewed as an endorsement by CoinIdol.com. Readers should do their research before investing in funds.
News
Price
Coin expert
News
Coin expert

(0 comments)