Bitcoin Cash Slumps at the $320 Resistance, Downward Move Likely
Updated: Dec 26, 2020 at 13:19

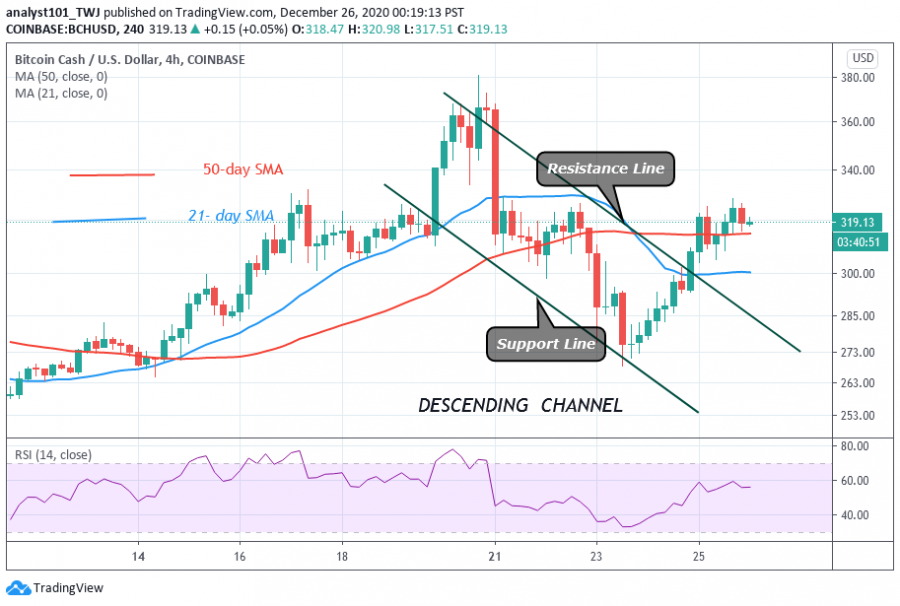
For the past 24 hours, Bitcoin Cash price has been hovering below and above the $320 resistance zone. Bitcoin bulls overcame their resistance on Christmas day but BCH failed to break its resistance convincingly.
The bullish momentum has been weak as bulls failed to sustain the upward move. On the upside, the bulls have to break the resistance at $320 and $360 for a rally above $400. If buyers are successful, a revisit of the February price level of $460 is achievable. Meanwhile, if the bulls fail to breach the resistance levels, the market will fall to the previous low at $268.
Bitcoin Cash indicator reading
BCH price has fallen to the support above the 50-day SMA. If the price breaks below the 50-day SMA, the downtrend will resume. The crypto has fallen to level 53 of the Relative Strength Index period 14. The coin is in the uptrend zone and above the centerline 50.

Key Resistance Zones: $440, $480, $520
Key Support Zones: $200, $160, $120
What is the next move for Bitcoin Cash?
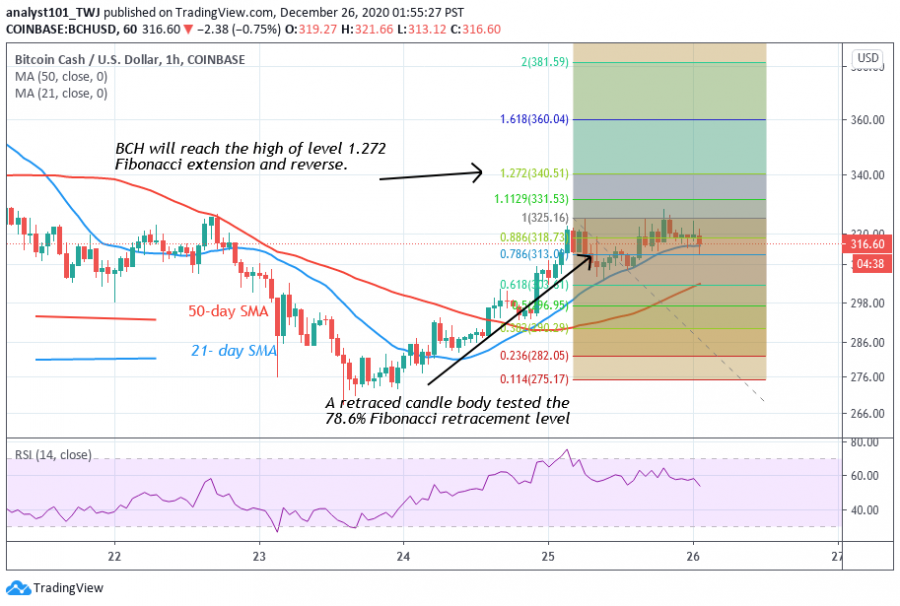
BCH's upward move is facing an initial resistance at the $320 price level. According to the Fibonacci tool analysis, the coin will move to the previous high. On December 25 uptrend; the retraced candle body tested the 78.6% Fibonacci retracement level. The retracement indicates that BCH is likely to rise to level 1.272 Fibonacci extensions. In other words, BCH will rise to a high of $340.51. However, the price will later reverse.

Disclaimer. This analysis and forecast are the personal opinions of the author that are not a recommendation to buy or sell cryptocurrency and should not be viewed as an endorsement by Coin Idol. Readers should do their own research before investing funds.
News
Coin expert
Politics
Price
Price

(0 comments)