Bitcoin Cash Bulls Stall Decline as They Face another Rejection at $134
Updated: Aug 10, 2022 at 11:54

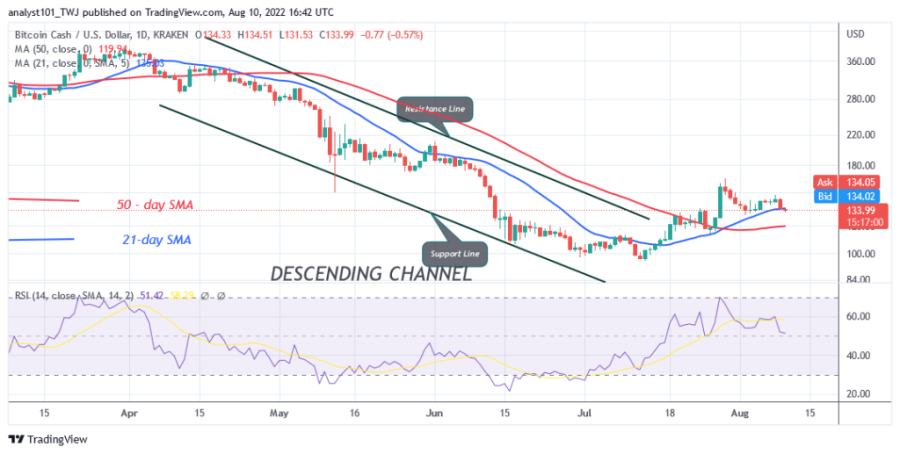
Bitcoin Cash (BCH) traded above its moving average lines last week. Initially, the bears failed to sustain the momentum below the moving average lines as the bulls halted the decline.
On August 8, the bulls set out on an upward move but were rejected at the $147 high. Today, the bears are trying to break below the moving average lines.
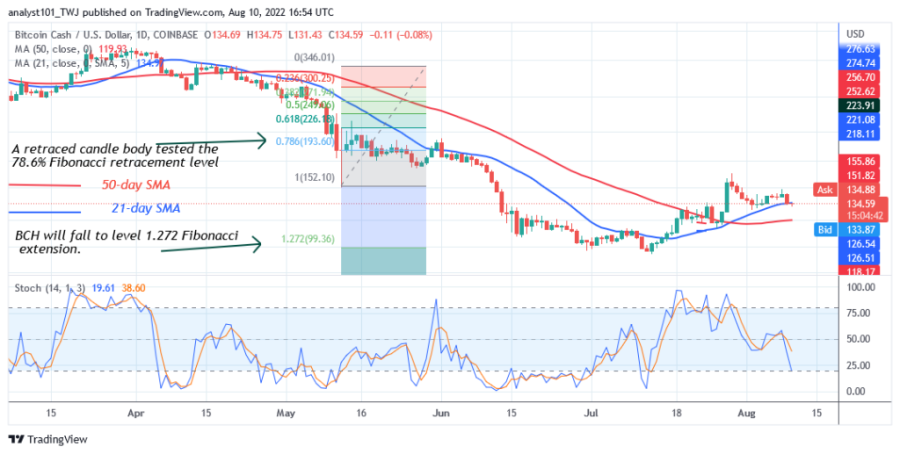
If the bears break below the 21-day line SMA, BCH will fall to the low of $120. However, if the selling pressure continues above the moving average, the decline will reach a low of $96. However, the bearish scenario will be invalidated if the altcoin holds above the lines. BCH/USD is trading at $133.98 at the time of writing.
Bitcoin Cash indicator reading
The cryptocurrency is at level 51 of Relative Strength for period 14, indicating that there is a balance between supply and demand. The price of the cryptocurrency is above the 21-day line SMA, but below the 21-day line SMA, indicating that BCH may resume the uptrend. BCH is below the 50% area of the daily stochastic. This suggests that the market is in a bearish momentum.

Technical Indicators
Key Resistance Zones: $130 and $150
Key Support Zones: $120 and $100
What is the next move for Bitcoin Cash?
Bitcoin Cash has regained its upward momentum, but the upward movement has been slowed down by the appearance of doji candlesticks. BCH could continue its sideways trend as it faces rejection at the upper resistance of $164. However, if the current support holds, the price could move back within the range.

Disclaimer. This analysis and forecast are the personal opinions of the author and are not a recommendation to buy or sell cryptocurrency and should not be viewed as an endorsement by Coin Idol. Readers should do their own research before investing funds.
News
Price
Price
News
Coin expert

(0 comments)