Bitcoin Cash Makes Positive Moves, Larger Uptrend Is Still Intact
Updated: Jan 22, 2021 at 15:11

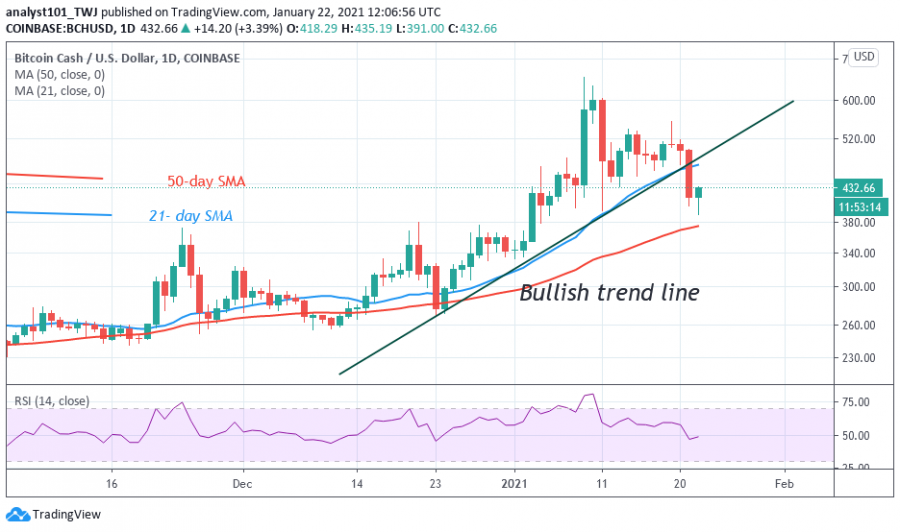
Bitcoin Cash has fallen and reached bearish exhaustion. The crypto dropped to $391 low after breaking the support levels of $430 and $470.
Today, the bulls buy the dips as the altcoin reaches the high of $431. BCH has risen into the previous price range of between $430 and $540. On the upside, if the bullish momentum is sustained, the coin is likely to rise to retest the $540 resistance. If the price fails to break the resistance at $540, BCH will resume a range-bound movement within the confined range. Buyers are making frantic efforts to push BCH to the previous highs. The bulls may encounter resistance at the $470 high.
Bitcoin Cash indicator reading
BCH price has broken the trend line. The implication is that it may bring a change in the trend. Technically, when price breaks and closes below the trend line, it indicates a change in the trend. The price action may indicate otherwise. The coin has fallen to level 48 of the Relative Strength Index period 14. It indicates that BCH is in the downtrend zone and below the centerline 50.

Key Resistance Zones: $560, $580, $600
Key Support Zones: $240, $220,$200
What is the next move for Bitcoin Cash?
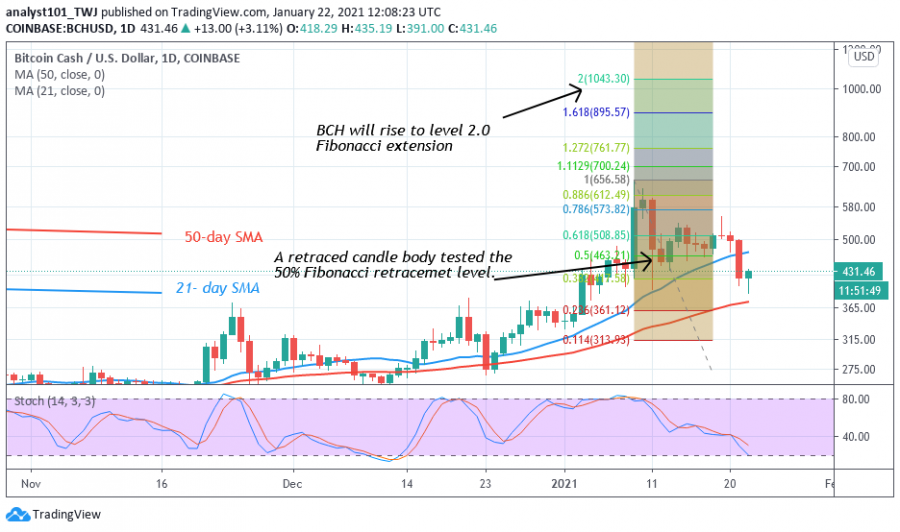
BCH is resuming a fresh uptrend after the recent downtrend. The Fibonacci tool will hold if the resistance at $540 and $650 is breached. On January 10 uptrend; the retraced candle body tested the 50% Fibonacci retracement level. The retracement indicates that BCH is likely to rise to level 2.0 Fibonacci extension. In other words, BCH will rise to a high of $1043.30.

Disclaimer. This analysis and forecast are the personal opinions of the author that are not a recommendation to buy or sell cryptocurrency and should not be viewed as an endorsement by Coin Idol. Readers should do their own research before investing funds.
News
Coin expert
Politics
Price
Price

(0 comments)