Bitcoin Cash Price Analysis: BCH Ranges as the Market Tussles
Updated: Oct 12, 2019 at 13:47

Bitcoin Cash is trading above the $200 demand zone; a break will mean a downtrend continuation. The market also makes an upward correction; a break above the $280 supply zone will mean a change in trend.
Bitcoin Cash price Long-term Prediction: Bearish
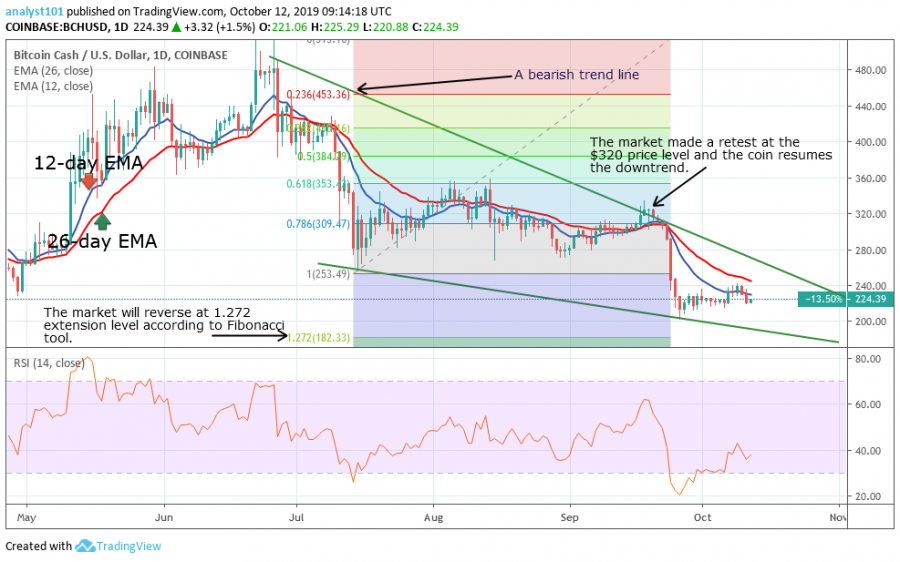
After the last bearish impulse in October, the price continues to consolidate above the $200 demand zone. For the past one week in October, the price corrected upward to a high of $240 but the price made a pullback to the $200 demand zone. This led to the formation of a price range.
As the Bitcoin Cash continues its trading within the range, a break below the $200 demand zone will compel the coin to further depreciate. Nevertheless, if the market also breaks above the $240 supply zone is a sign that an uptrend is resuming. Similarly, a break above the $280 supply zone is a signal that the downtrend is over.
Bitcoin Cash Indicator Reading
On October 12, Bitcoin Cash is in a downtrend and if the bearish trend line is breached and the candlestick closes above it, BCH will rise. The downtrend will commence, the moment the market fails to breach the bearish trend line.
That is to say that the BCH will fall to a low of $166 price level. The Fibonacci tool shows additional depreciation to a low of 1.272 extension level and thereafter a reversal will occur. The Relative Strength Index period 14 is level 35 indicates that the market is approaching the oversold region.

What is the next direction for Bitcoin Cash?
Bitcoin Cash may continue its downward move if the bearish trend line is unbroken. In September, the market had earlier failed to break the downtrend line which resulted in the last downward move. These market fluctuations will continue until any of this level is broken.
Key Supply Zones: $320, $360, $400
Key Demand zones: $200, $160, $120
Disclaimer. This analysis and forecast are the personal opinions of the author are not a recommendation to buy or sell cryptocurrency and should not be viewed as an endorsement by Coin Idol. Readers should do their own research before investing funds.
Politics
Price
Price
News
Price

(0 comments)