Bitcoin Gains Ground And Breaks Through The $60,000 Level
Updated: Oct 12, 2024 at 11:58

The price of Bitcoin (BTC) has held on to the psychological $60,000 mark despite the drop on October 10.
Long-term forecast for the BTC price: bullish
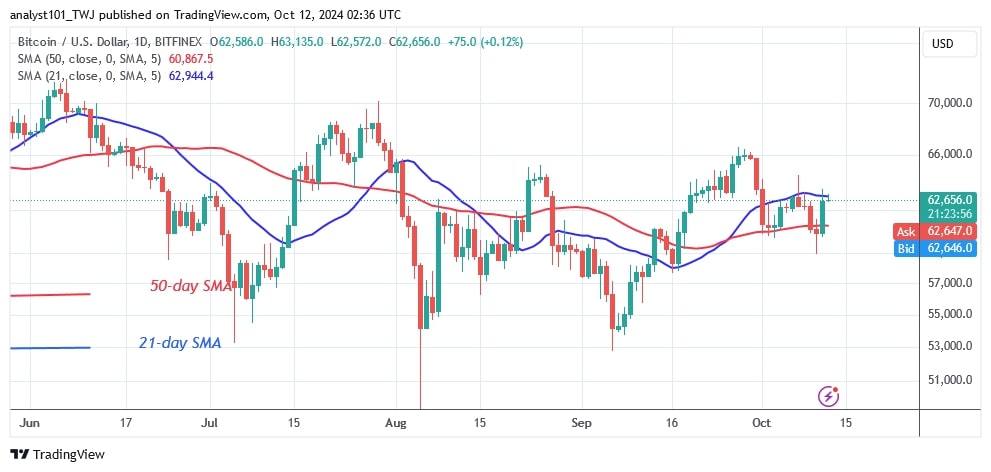
On October 10, Bitcoin fell to a low of $58,943, but the bulls bought the dips. The largest cryptocurrency rallied above the moving average lines but was halted by the 21-day SMA resistance. If the bulls break through the 21-day SMA resistance, Bitcoin will rally to the next resistance at $65,000.
The bullish momentum will now continue to the high of $70,000. Bitcoin is trading at $62,641, above the 50-day SMA support but below the 21-day SMA resistance. The trend will depend on when the moving average lines are broken.
BTC indicator reading
After the breakdown on October 9, Bitcoin has recovered between the moving average lines. The moving average lines have remained horizontal as Bitcoin continues to trade between $55,000 and $70,000.
In addition, the moving average lines have maintained their positive crossover, suggesting that Bitcoin price will continue to rise.
Technical indicators:
Key Resistance Levels – $70,000 and $80,000
Key Support Levels – $50,000 and $40,000

What is the next direction for BTC?
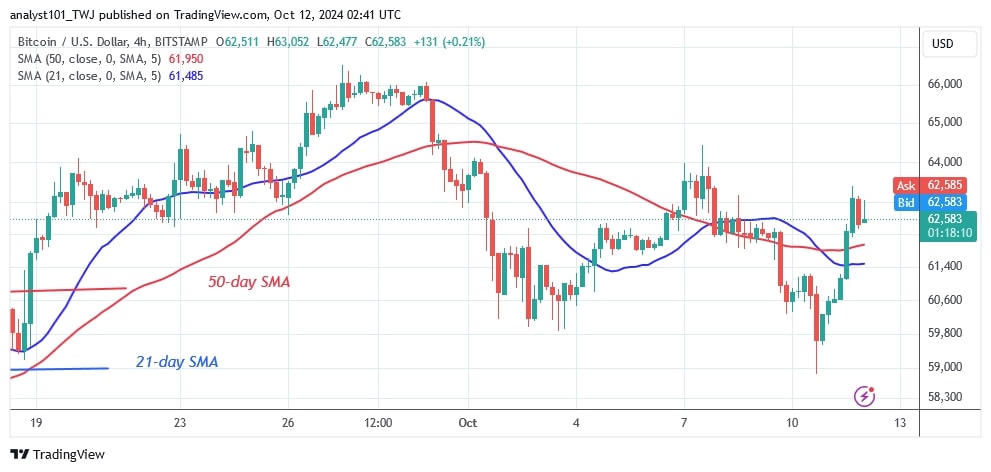
On the 4-hour chart, Bitcoin is trading in a narrow range between $59,000 and $64,000. The largest cryptocurrency value was previously flattened at the $65,000 mark. The Bitcoin price is hovering just above the psychological milestone of $60,000. The upward trend is halted by resistance at $64,000.

Coinidol.com reported on October 8 that buyers have stopped the selling pressure after recovering above the $60,000 support or the 50-day SMA
Disclaimer. This analysis and forecast are the personal opinions of the author. They are not a recommendation to buy or sell cryptocurrency and should not be viewed as an endorsement by CoinIdol.com. Readers should do their research before investing in funds.
Price
Price
News
News
Price

(0 comments)