Bitcoin Price Reaches Its High Of $65,000 And Backs Down

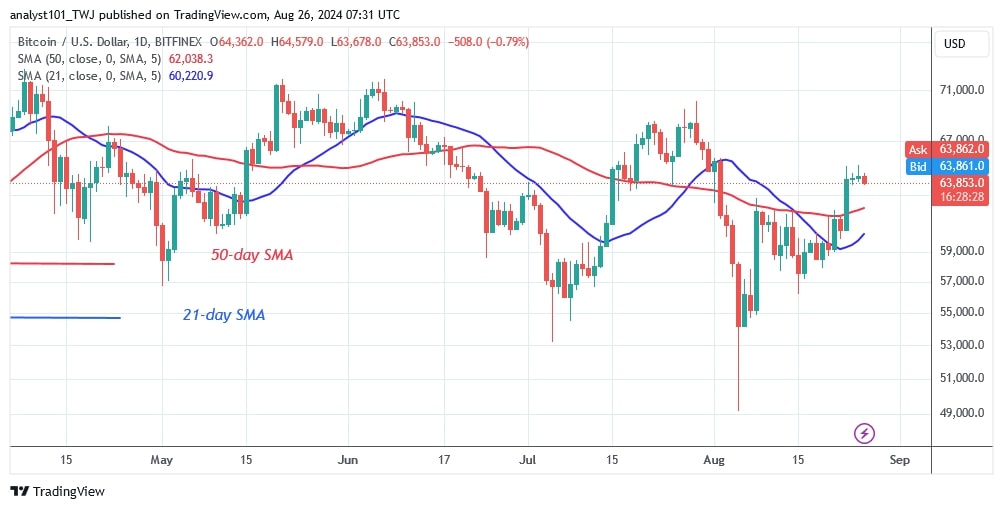
Bitcoin (BTC) is in an upward correction within a horizontal trend. Bitcoin price analysis by Coinidol.com.
In the past price activity, Bitcoin was trading above the $55,000 support but below the moving average lines.
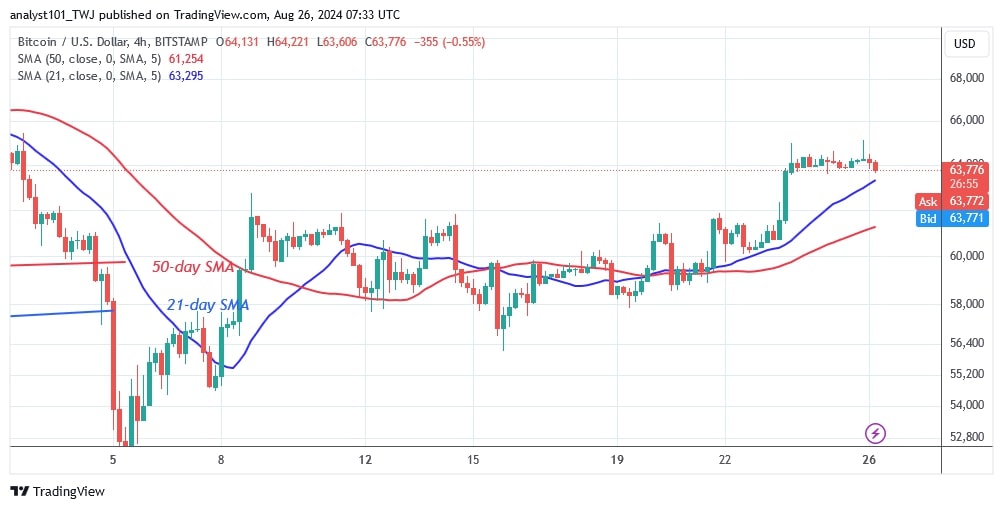
On August 21, the bulls had the upper hand as the cryptocurrency price broke above the moving average lines. On August 23, the cryptocurrency price reached a high of $65,074. However, the upward momentum has peaked at over $65,000. Since August 1, buyers have failed to sustain their bullish momentum above the $65,000 peak.
BTC price long-term prediction: bullish
Now, buyers should break through the $65,000 mark to make Bitcoin rise to the psychological price level of $70,000. Bitcoin is making a small pullback after hitting a barrier at its recent high. The uptrend could continue if Bitcoin retraces and finds support above the 50-day SMA. However, selling pressure will return if the bears break below the 50-day SMA support. Bitcoin's current value stands at $61,879.
Reading BTC price indicators
After the recent price rise on August 21, the Bitcoin price has recovered back above the moving average lines, as it was reported by Coinidol.com previously. Bitcoin will try to rise while staying above this line.
Since August 23, the Bitcoin price has been fluctuating above the moving average lines but below the $65,000 resistance level. If the barriers are broken, the cryptocurrency will rise.
Technical indicators:
Key Resistance Levels – $70,000 and $80,000
Key Support Levels – $50,000 and $40,000

What is the next direction for BTC/USD?
In the last 48 hours, the Bitcoin price has moved above the support level of $63,000 after reaching the resistance level of $65,000. Bitcoin peaks at $65,000 and then starts to fall again. The cryptocurrency is trading above the $62,000 support but below the $65,000 level. The direction of the market will be determined after the existing support and resistance levels are broken.

Disclaimer. This analysis and forecast are the personal opinions of the author. They are not a recommendation to buy or sell cryptocurrency and should not be viewed as an endorsement by CoinIdol.com. Readers should do their research before investing in funds.
News
Price
Coin expert
News
Coin expert

(0 comments)