Bitcoin Begins Ascent But Faces The Barrier Of $68,000

The price of Bitcoin (BTC) has continued its upward trend after falling above the $64,000 support level on July 25.
Bitcoin price long-term forecast: bullish
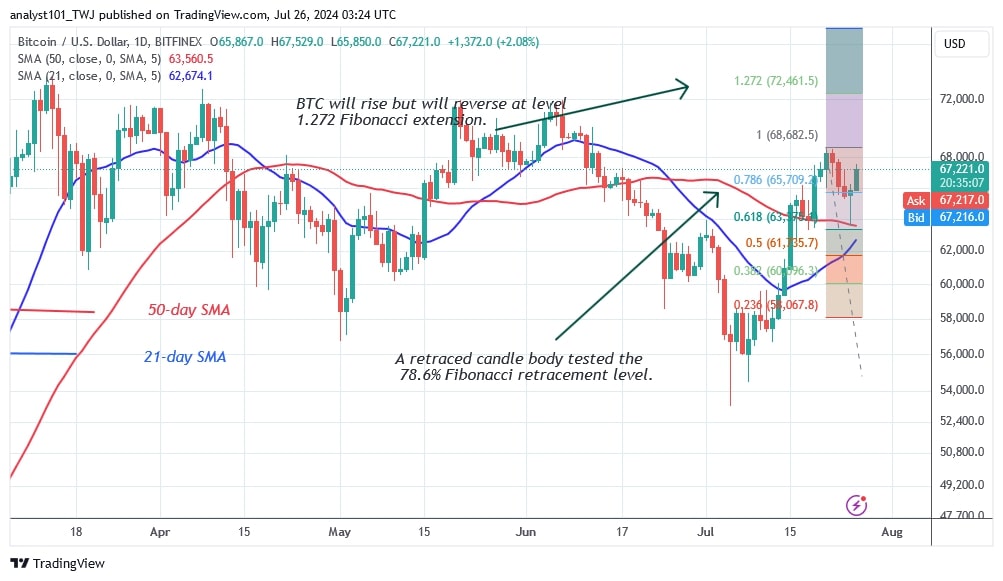
Bitcoin reached a high of $68,479 on July 21 before falling back as reported by Coinidol.com. The correction has led to a further upward movement of the largest cryptocurrency. The Bitcoin price has continued its rise today, reaching a high of $67,100.
If the bulls overcome the resistance of $68,000, the cryptocurrency will rise to a high of $72,000.
However, if the bulls fail to break the $68,000 level, Bitcoin will fall and be forced to trade in an area above the moving average lines or the $64,000 support but below the $68,000 resistance level.
Bitcoin indicator reading
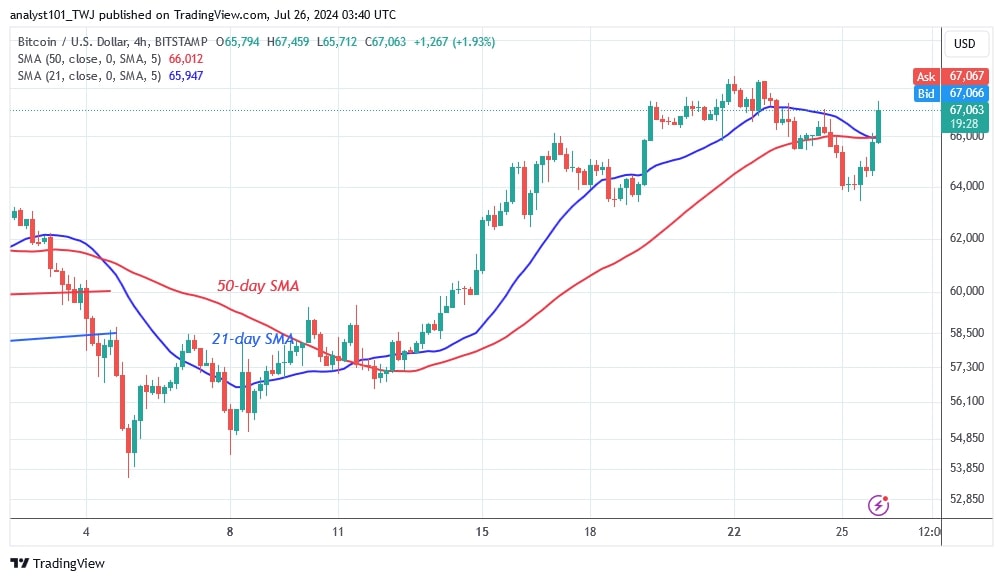
On July 25, a long candlestick tail points to the 50-day SMA support. There is strong buying pressure above the 50-day SMA support. The 4-hour chart of Bitcoin shows a sideways trend between $64,000 and $68,000.
Technical indicators:
Key resistance levels – $70,000 and $80,000
Key support levels – $50,000 and $40,000

What is the next direction for BTC/USD?
Bitcoin continues to trade within the bullish trend zone. On the 4-hour chart, the cryptocurrency has started to move within a trading range after the July 19 rise. The largest cryptocurrency is trading in a price range of $64,000 to $68,000. Bitcoin tested the $68,000 mark again, but failed to break through.

Disclaimer. This analysis and forecast are the personal opinions of the author and are not a recommendation to buy or sell cryptocurrency and should not be viewed as an endorsement by CoinIdol.com. Readers should do their research before investing in funds.
Price
Price
Price
Price

(0 comments)