Bitcoin Price Rises And Reaches The $65,000 Threshold
Updated: Sep 25, 2024 at 12:38

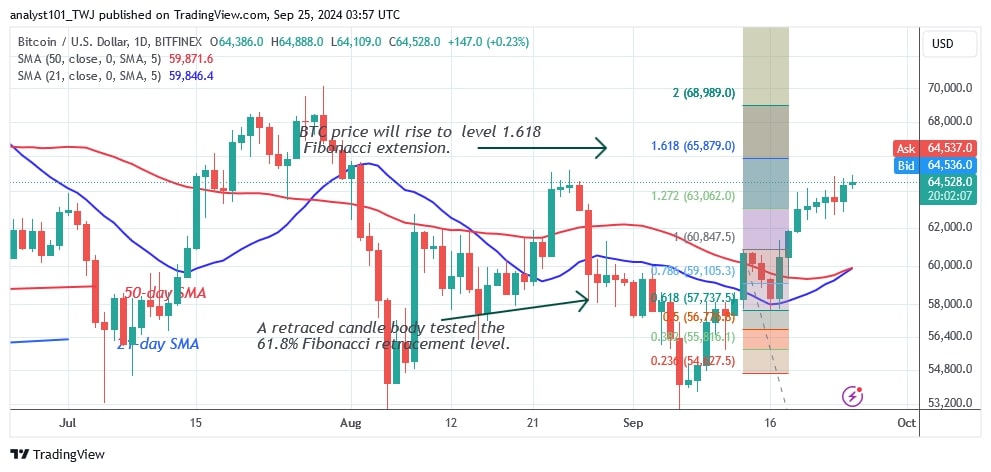
The price of Bitcoin (BTC) is rising and buyers intend to push it above the $65,000 resistance level.
Long-term forecast for the Bitcoin price: bullish
The largest cryptocurrency broke through the moving average lines but was stopped at the $60,000 high. The bulls overcame the first obstacle by rising above the moving average lines. Bitcoin rose above the 21-day SMA support and broke through the resistance level at $60,000. Bitcoin's price is currently at $64,628, close to the target.
On the upside, the bears are expected to resist the cryptocurrency's ongoing uptrend. Bitcoin will fall and trade above the moving average lines while remaining above these lines if it is rejected at its recent high. It will continue to depreciate and reach the $60,000 support level. However, if Bitcoin price rises and breaks through the $65,000 level, it will rally to the psychological price of $70,000.
Bitcoin indicator reading
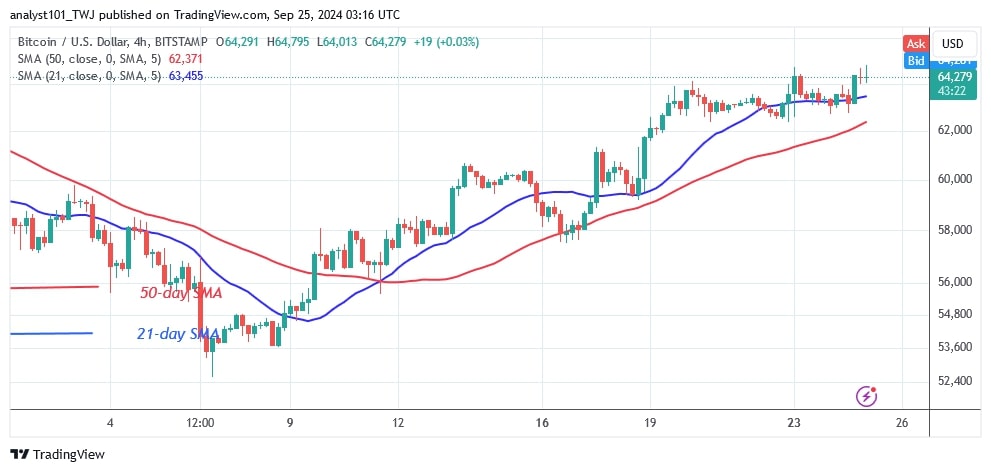
Bitcoin is in an uptrend, with the price having made a series of higher highs and higher lows. On the 4-hour chart, the moving average lines are sloping north, indicating an uptrend. The current uptrend is interrupted when the price falls below the moving average lines. Doji candlesticks form, signalling the end of the uptrend.
Technical indicators:
Resistance Levels – $70,000 and $80,000
Support Levels – $50,000 and $40,000

Bitcoin price in recent weeks
Bitcoin is in an uptrend and reached a high of $64,730 on September 2. The uptrend has slowed down as the BTC price has fallen below the $65,000 area. However, the uptrend has paused below the $65,000 resistance level. On August 23, Bitcoin reached its current price but was rejected. The largest cryptocurrency fell below the moving average lines and reached a low of $52,756. Today, Bitcoin is trading below the high of $65,000.

On September 13, buyers kept the price above the moving average lines, although there was selling pressure at the $60,000 high, as reported by Coinidol.com earlier.
Disclaimer. This analysis and forecast are the personal opinions of the author. They are not a recommendation to buy or sell cryptocurrency and should not be viewed as an endorsement by CoinIdol.com. Readers should do their research before investing in funds.
Price
Price
News
News
Coin expert

(0 comments)