Bitcoin Slumps, Unable To Sustain Above $60,000 Psychological Price Level

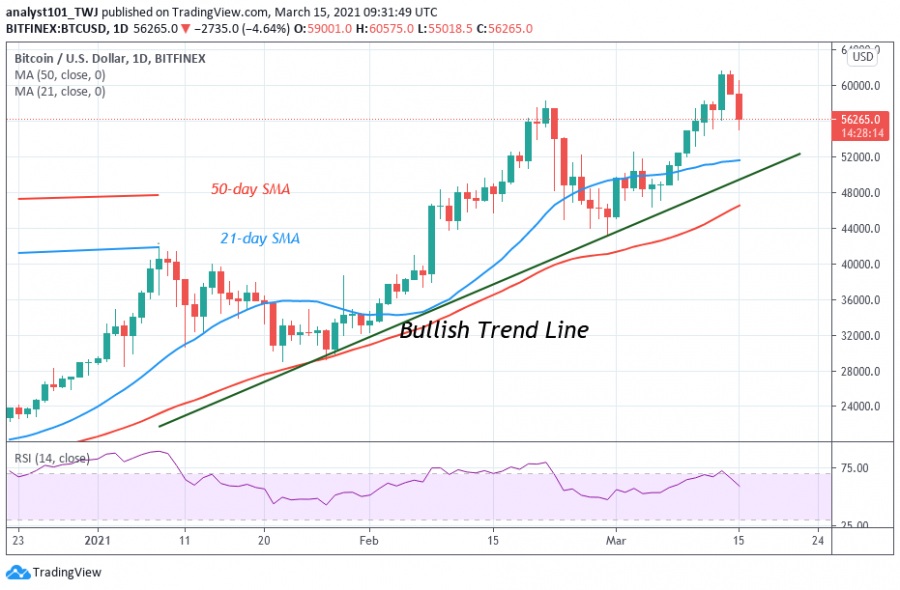
On March 14, BTC price rallied to $61,699 high but the bullish momentum could not be sustained above the $60,000 psychological price level. Consequently, Bitcoin price retraced from the recent high.
It is now customary for Bitcoin price to attain new highs but will later encounter occasional drawdowns. Today, the market has declined to $55,000 support and price made a pullback. The recent decline is not unconnected about the market reaching the overbought region. Bitcoin has been trading in the overbought region for the past week.
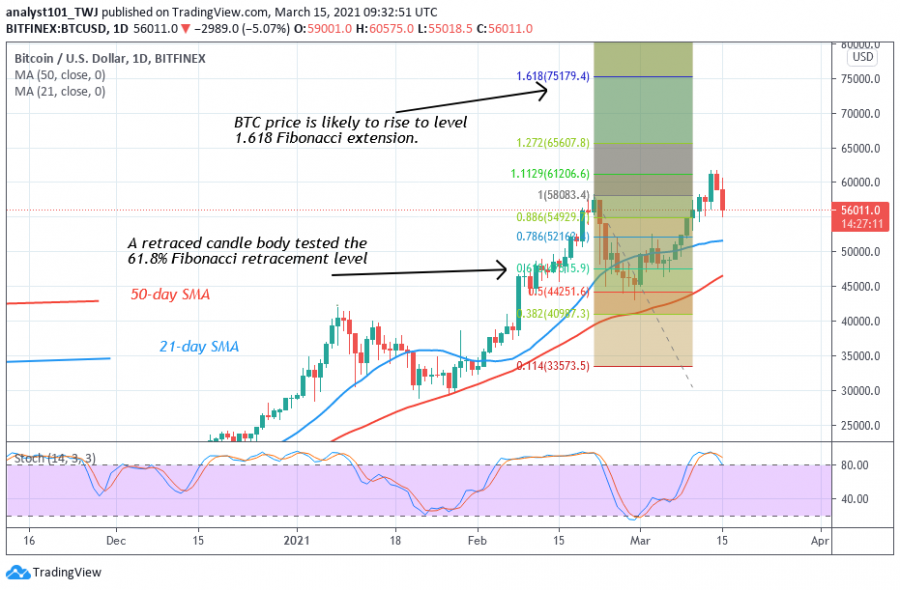
Sellers were aggressively defending the $60,000 psychological price level. Meanwhile, if the $55,000 support holds, buyers will resume upside momentum. The bulls will have to retest the $58,000 resistance to break above it. Similarly, if the $58,000 and $60,000 price levels are breached, Bitcoin will have another price target of $75,000. This has been indicated by the price indicator. Nevertheless, the BTC/USD is trading at $56,160 at the time of writing.
Bitcoin indicator reading
The Relative Strength index period 14 has fallen to level 58 from the overbought region. However, the price is in the uptrend zone as it falls to the previous lows. The daily stochastic is below 80% range and the bands are sloping below it. It indicates that Bitcoin is in a bearish momentum.

Technical indicators:
Major Resistance Levels – $60,000 and $62,000
Major Support Levels – $45,000 and $40,000
What is the next direction for BTC/USD?
Bitcoin price is in a downward move but the recent rallies are intact. Meanwhile, after the retracement, the price is likely to resume upward. On February 21 uptrend; a retraced candle body tested the 61.8% Fibonacci retracement level. The retracement indicates that the market will rise to level 1.618 Fibonacci extension or the high of $75,179.40.

Disclaimer. This analysis and forecast are the personal opinions of the author that are not a recommendation to buy or sell cryptocurrency and should not be viewed as an endorsement by CoinIdol. Readers should do their own research before investing funds.
Price
News
Price
News
News

(0 comments)